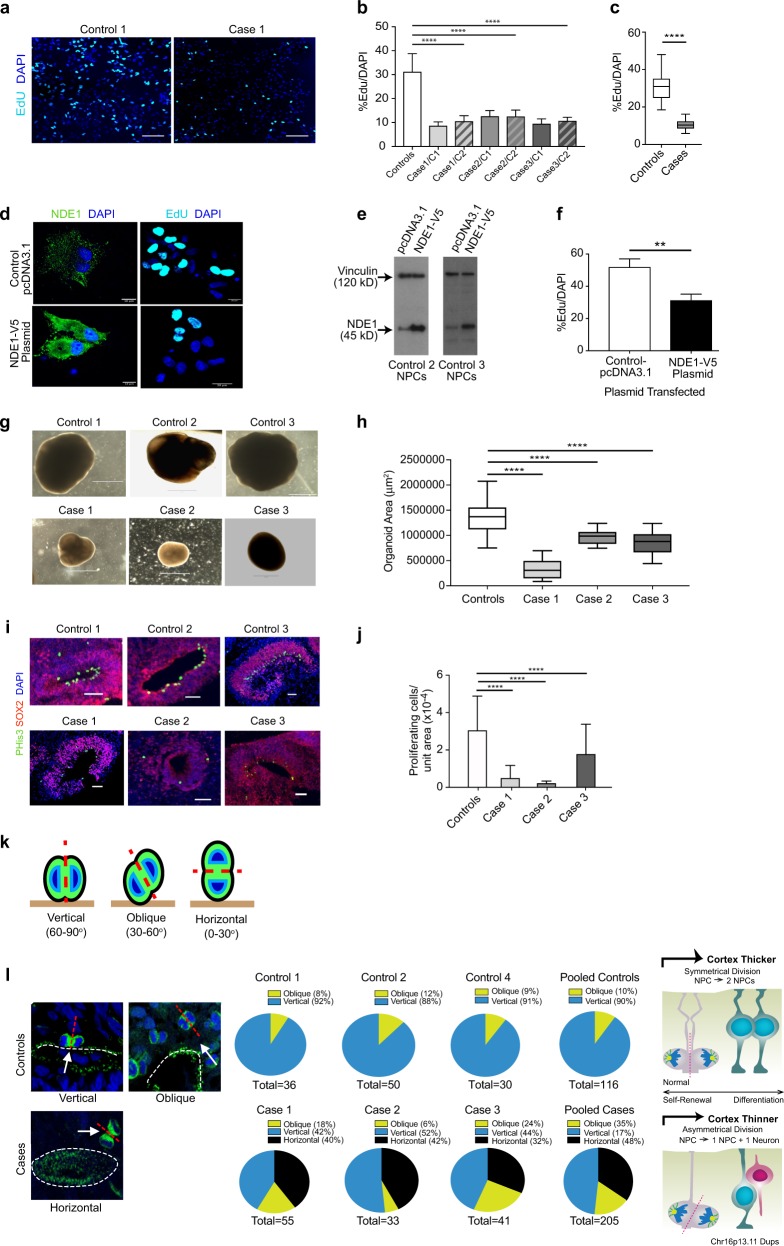
Fig. 2.
Proliferation studies of NPCs and cerebral organoids. a Representative images of the mean proliferation values of case 1 compared to control 1. Scale bar: 50 µm. NPCs from case and control lines were plated down and grown in default media for 7–10 days prior to Click-IT EdU proliferation assays being undertaken. b NPCs from affected cases carrying the Chr16p13.11 microduplication show significantly reduced proliferation compared to control lines. Two NPC lines derived from two independent iPSC clones from each case were compared to a panel of NPC lines derived from five control individuals. c Graph showing values for pooled control NPC lines compared to pooled case NPC lines. Graphs shows mean ± sem, controls: 31.26 ± 1.14%, cases 10.5 ± 0.298%, ****p < 0.0001 (unpaired two-tailed t-test with Welch’s correction). d NPCs from control individuals (control 2 and 3) were transfected either with full-length human V5-tagged NDE1 (pcDNA3.1NDE1-WT-V5 construct) or with the plasmid alone (pcDNA3.1). NDE1 staining shows intense signal of NDE1 in the cytoplasm of cells which had been transfected with the NDE1-V5 construct compared to NPCs transfected with control plasmid. e Immunoblotting shows that NPCs, derived from healthy controls and transfected with pcDNA NDE1-WT-V5 construct, expressed significantly more NDE1 compared to NPCs transfected with pcDNA3.1-control plasmid alone. f Proliferation assays post-transfection: Electroporated cells were plated down and 48 h later EdU was added to measure the proliferation rate of transfected cells (right hand panel of d). f Graph shows that cells transfected with full-length wild-type human NDE1 display significantly reduced proliferation over a 10-h time-period compared to empty vector transfected cells. Graph shows mean ± sem, **p < 0.005 (p = 0.0036, paired t-test; mean = 51.98% EdU/DAPI for empty vector control transfected NPCs compared to mean = 31.3% EdU/DAPI for NPCs transfected with full-length NDE1). g Representative images of cerebral organoids from controls and cases at 1 month of age. Scale bar: 1000 μm (1 mm). g Plot of organoid sizes (organoid area μm2) from controls and cases at 1 month. Data represented as box plots with central bar representing mean ± sem shown by whiskers; ****p < 0.0001, ordinary one-way ANOVA with Dunnett’s multiple correction test. Case 1 organoids are significantly smaller than controls (mean area of 326,550 μm2 for case 1 organoids compared to mean of 1,364,157 μm2 for controls. Case 2 and 3 organoids were less severely stunted in their growth rates with mean areas of 973,586 and 856,846 μm2, respectively). Organoid n = 30 + per case. i Representative images of proliferative zones of 1-month-old organoids from control compared to case iPSC lines. Scale bar: 50 µm. j Graph of proliferating cells (P-His+ve) quantified in sectioned organoids showing pooled values of different clones for each case. Organoids were sectioned, stained and quantified using Image J by two independent blinded examiners. Family control organoids are from n = 3 individuals. Data represented as mean ± sem; ****p < 0.0001, ordinary one-way ANOVA with Dunnett’s multiple correction test. Chr16p13.11 microduplications result in a switch from symmetrical to asymmetrical cell division. k Schematic diagram illustrating RG division in one of three orientations: 60–90 degrees (vertical); 30–60 degrees (oblique) and 0–30 degrees (horizontal). l Cerebral organoids were sectioned and stained with antibodies to phospho-histone H3 and/or phospho-vimentin. Quantification of RG division orientations is displayed in pie charts next to representative images for case and control organoids examined showing the proportion of cells in one of three bins (vertical, oblique or horizontal) n = 30–50 anaphase cells from a minimum of five cerebral organoids from each line. Schematic diagram (right) illustrating potential consequences to cortical thickness following a switch from symmetric to asymmetric cell division in affected carriers of Chr16p13.11 microduplications

