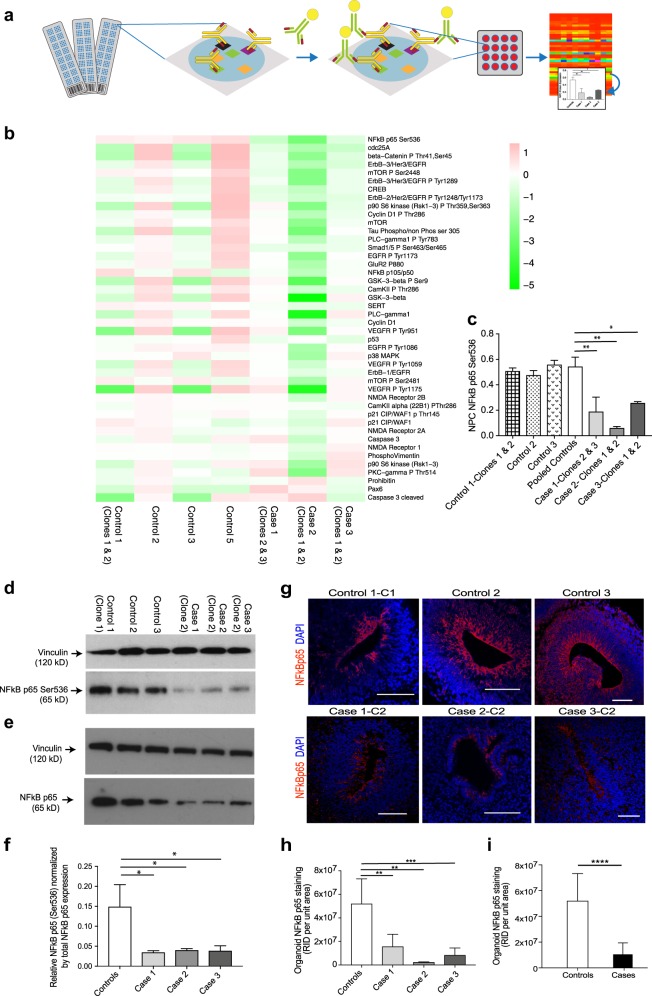
Fig. 4.
NFκB p65 protein levels are significantly downregulated in NPCs and cerebral organoids from cases compared to controls. a Schematic overview of RPPA. b RPPA heatmap for the pooled data, i.e. each block is representing the value log2(protein abundance in line/mean abundance for this protein). Data are ordered by decreasing values of (mean protein abundance in cases)/(mean protein abundance in controls). Note that NFκB appears as the top “downregulated” protein in the cases. c Graph of anti-phospho-NFκB p65 (Ser536) expression in NPCs from case lines versus control lines determined by RPPA (Note that in the RPPA experiments we tested 2 clones for each of cases 1, 2 and 3; 2 clones for control 1; and one clone each from controls 2, 3 and 5. Each clone was run in triplicate). Statistics: mean ± sem is shown; *p = 0.05; **p < 0.005 (ordinary one-way ANOVA with Dunnett’s multiple comparisons test). d Immunoblot of cell lysates from case-derived NPCs compared to controls stained with anti-phospho-NFκB p65 (Ser536) and anti-vinculin loading control antibody. e Immunoblot of cell lysates from case-derived NPCs compared to controls stained with total NFκB p65 antibody and anti-vinculin loading control antibody. f Quantification of immunoblots showing anti-phospho-NFκB p65 (Ser536) normalized by total NFκB p65 in pooled cases compared to controls. Statistics: mean ± sem is shown; *p = 0.05 (ordinary one-way ANOVA with Dunnett’s multiple comparisons test). g Representative images of proliferative zones of 1-month-old organoids from individual control iPSC lines compared to individual case lines stained with anti-NFκB p65 (red). Scale bar: 100 µm. h Graph of NFκB p65 staining of cerebral organoids from three individual cases compared to three individual controls and also i graph of NFκB p65 staining of cerebral organoids from pooled cases compared to pooled controls. Raw integrated density (the sum of the values of the pixels per unit area of organoid) was determined by capturing organoid images at the same magnification and calculated using Image J. Statistics: mean ± sem is shown; **p < 0.005; ***p < 0.0005; ****p < 0.0001 (Mann–Whitney test)

