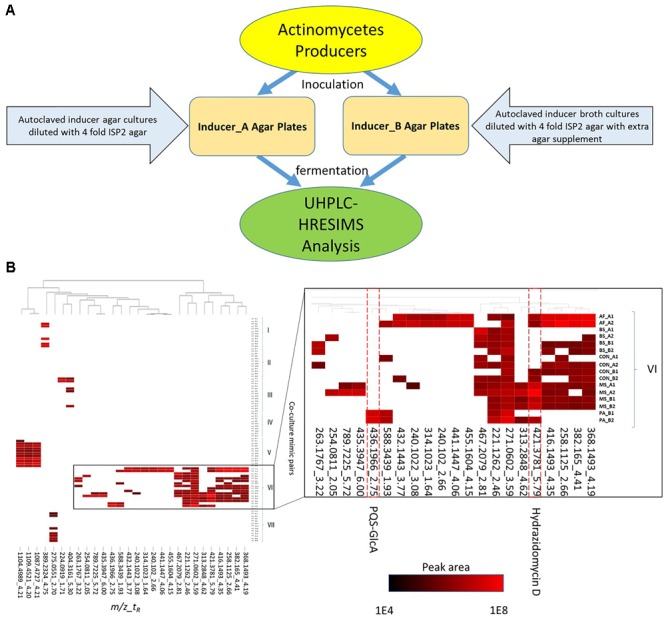
FIGURE 1.

Inducer-producer culture strategy and metabolomic analysis. (A) Inducer-producer culture strategy overview. (B) UHPLC-HRESIMS based untargeted metabolomic analysis. 28 mass features are selected in the heatmap based on induction, upregulation, and peak area abundance. The vertical axis indicates actinomycete and inducer-producer pairings. Four inducer organisms include: PA, P. aeruginosa; BS, B. subtilis; MS, M. smegmatis; and AF, A. flavus. Preparation of the inducer organisms in ISP2 agar or broth is indicated by (A) or (B), respectively. The control experiments (CON) were prepared by adding twice-autoclaved ISP2 media to the mono-cultures of the producers. The two experimental replicates are indicated by 1 or 2. The horizontal axis indicates induced mass features (detected ions defined by a m/z and tR window) from UHPLC-HRESIMS analysis. The mass features are presented in a m/z_tR format and are clustered across different culture experiments. The white cells indicate peak areas <1E4, while peak areas from 1E4 to 1E8 were scaled from black (1E4) to red (1E8).
