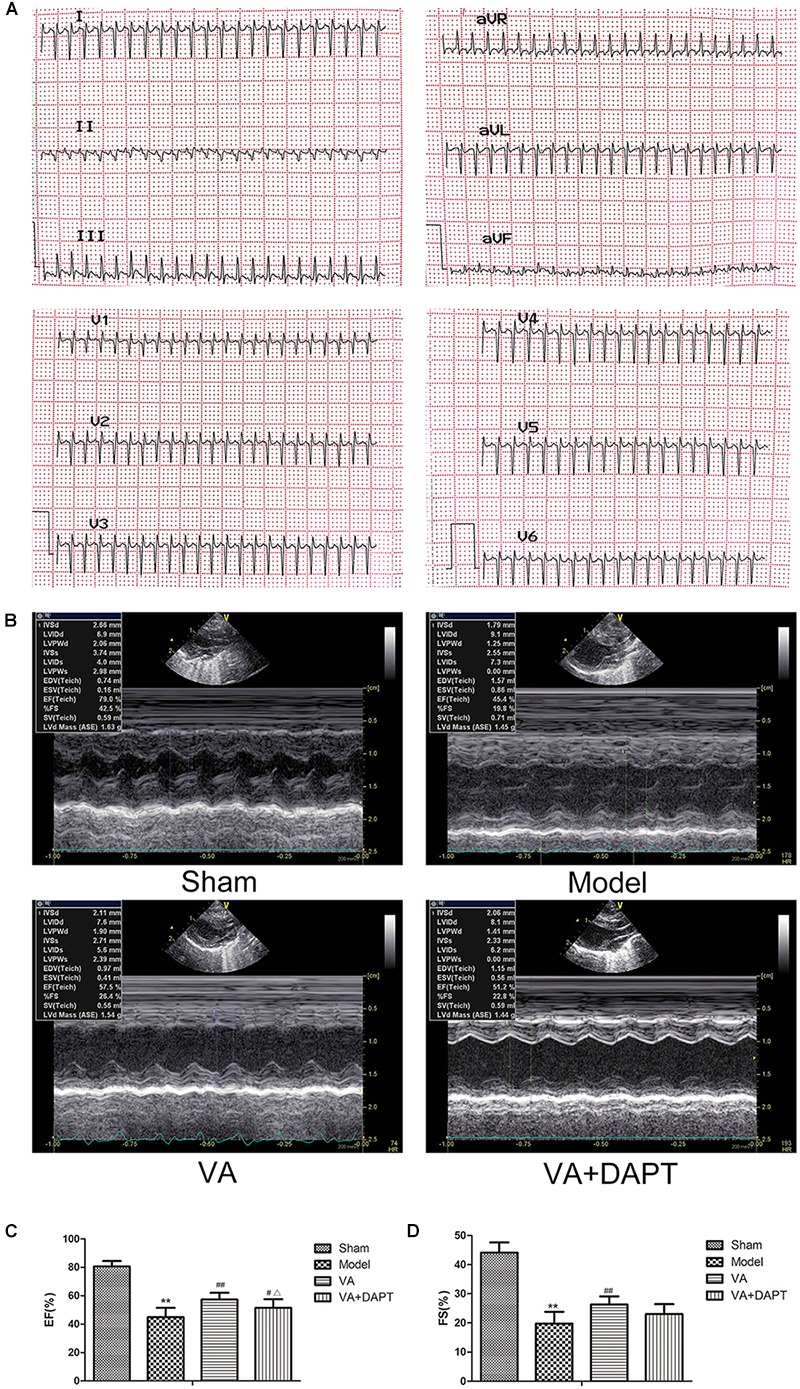
FIGURE 2.

Changes of electrocardiogram and echocardiography in rats. (A) Q waves indicated that the surgery was successful. (B) Left ventricular long-axis views 7 days after MI. (C) Left ventricular ejection fraction (EF). (D) Left ventricular fractional shortening (FS). MI resulted in a visible drop in the ultrasonic changes in the model group, and the ultrasonic changes in VA groups were alleviated compared with the model group. ∗∗P < 0.01 compared with the sham group; #P < 0.05 and ##P < 0.01 compared with the model group; Δ P < 0.05 compared with the VA group. N = 8.
