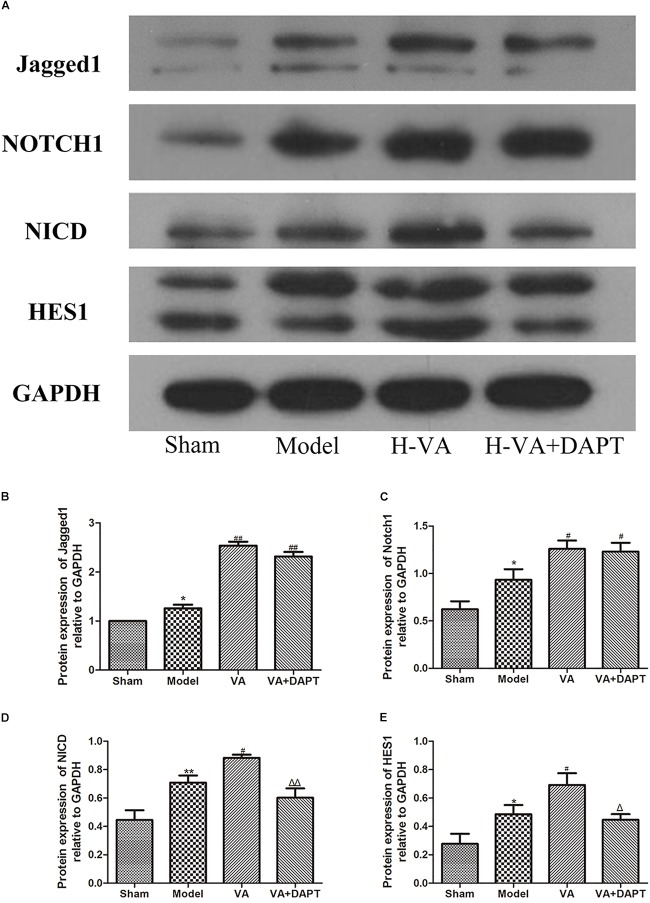
FIGURE 7.
Expressions of Notch pathway related proteins in the border zone of MI. (A) Bands of different proteins. (B–E) Protein expressions of Jagged-1, Notch1, NICD and HES1 relative to GAPDH, respectively. ∗P < 0.05 and ∗∗P < 0.01 compared with the sham group; #P < 0.05 and ##P < 0.01 compared with the model group; Δ P < 0.05 and ΔΔ P < 0.01 compared with the VA group. N = 5.

