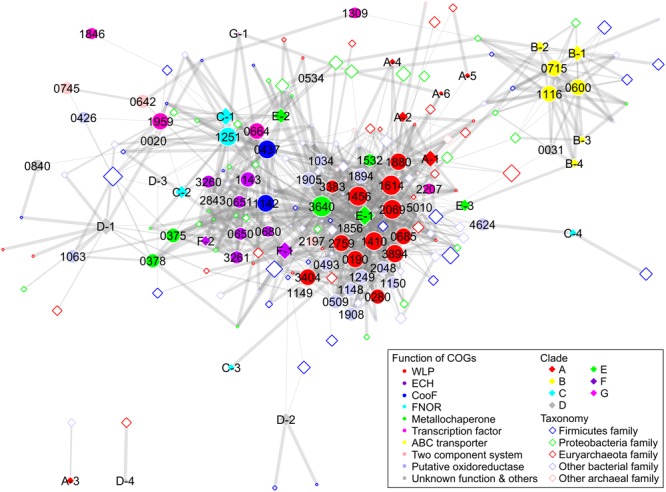
FIGURE 5.

Network analysis of Ni-CODH-related proteins, structural groups of Ni-CODHs, and taxonomies focusing on the genomic contexts. The network is represented by an unweighted force-directed layout and manually modified to avoid the overlapping nodes. The width of the edges is scaled proportionally according to the Simpson coefficient. The size of the nodes is scaled proportionally according to the log of the number of gene loci of Ni-CODHs with each COG, structural group, and taxonomy. The COGs, structural groups of Ni-CODHs, and family level taxonomies are shown by filled circles, filled diamonds, and open diamonds, respectively, and colored according to their functions, clades, and phyla as inset, respectively. The taxonomy omitted network is shown in Supplementary Figure 3 in order to explain the functional groups of the Ni-CODH-related proteins.
