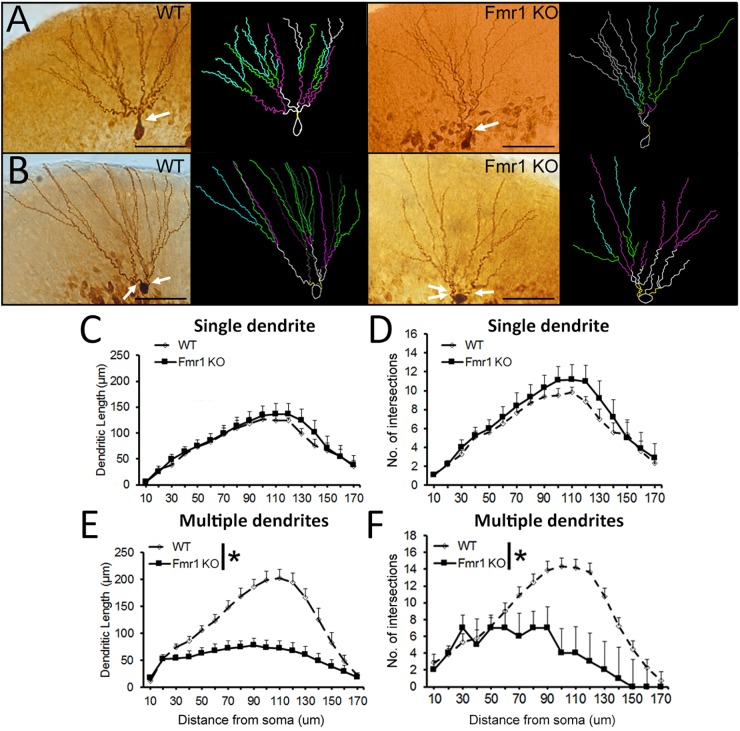
FIGURE 5.
Sholl analysis of biocytin-filled granule cells. (A) Representative images of younger and (B) mature granule neurons from WT and Fmr1 KO mice. Scale bar: 50 μm. (C,D) There were no differences in dendritic length and number of intersections in younger granule cells between WT (n = 10) and Fmr1 KO mice (n = 8). (E,F) Dendritic length and number of intersections in more mature granule cells were significantly decreased in Fmr1 KO mice (n = 10) when compared to WT mice (n = 12). Arrows: primary dendrites (yellow traces). ∗P < 0.005 (five animals per group; ANOVA, repeated measures).

