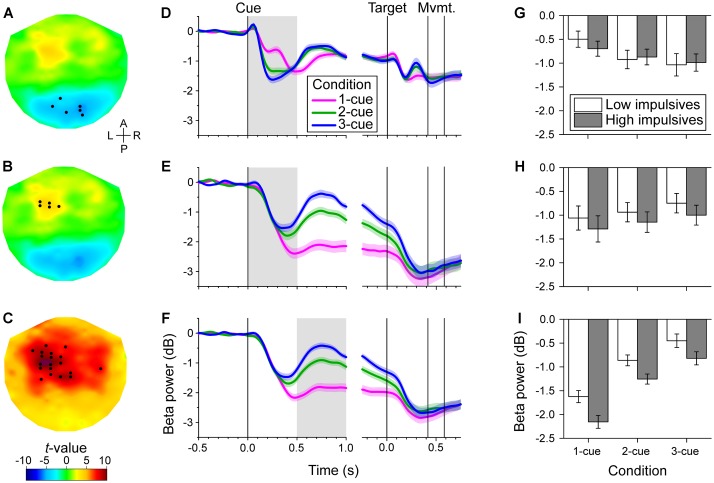
FIGURE 3.
Channel-level analysis of beta band power during the task. We found that the power was significantly correlated with the number of cues during the early cue period (0–0.5 s after cue onset) and during the late cue period (0.5–1 s after cue onset), but not during the response period. (A–C). Topographic maps of the t-values for the dependent samples regression between relative beta power and number of cues during the early cue period (A,B), and during the late cue period (C). The t-values were interpolated between channels using a thin-plate spline for graphic purposes. The black dots identify the channels that were selected by the cluster-based analysis. The early cue period was characterized by two groups of channels, a posterior group with a slight preponderance to the right, of negative correlation with number of cues (A), and a left fronto-central group of positive correlation with number of cues (B). In contrast, the late cue period was characterized by a predominantly left fronto-central group of channels of positive correlation with number of cues (C). The anterior-posterior (A–P) and left-right (L–R) axes are indicated in A. (D–F). Cue and target aligned time series of mean beta band relative power across cue conditions for the channels identified in the same row on the left topographic maps. The shaded areas along the curves indicate the standard error of the mean (N = 50 participants). The gray rectangles identify the epoch of interest. Vertical lines indicate, from left to right, cue onset, target onset, grand mean of movement onset (RT) and offset (MT). The decrease in beta band power was greater the greater the number of cues for the posterior channels during the early cue period (D). In contrast, the decrease of beta band power was smaller the greater the number of cues for the left fronto-central group during the early cue period (E), and late cue period (F). (G–I). Bar graphs of relative beta band power across cue condition and impulsivity group for the channels and epoch of interest identified on the same row. Error bars represent the standard error of the mean (Low impulsivity N = 24; High impulsivity N = 26). The decrease of beta band power of the left fronto-central channels during the late cue period was significantly greater for the high impulsivity group than for the low impulsivity group (I). The same tendency was observed for the left fronto-central channels during the early cue period (H), although that was not significant. There was a number of cues x impulsivity group interaction for the posterior channels during the early cue period (see text), although this did not survive Bonferroni correction (G).

