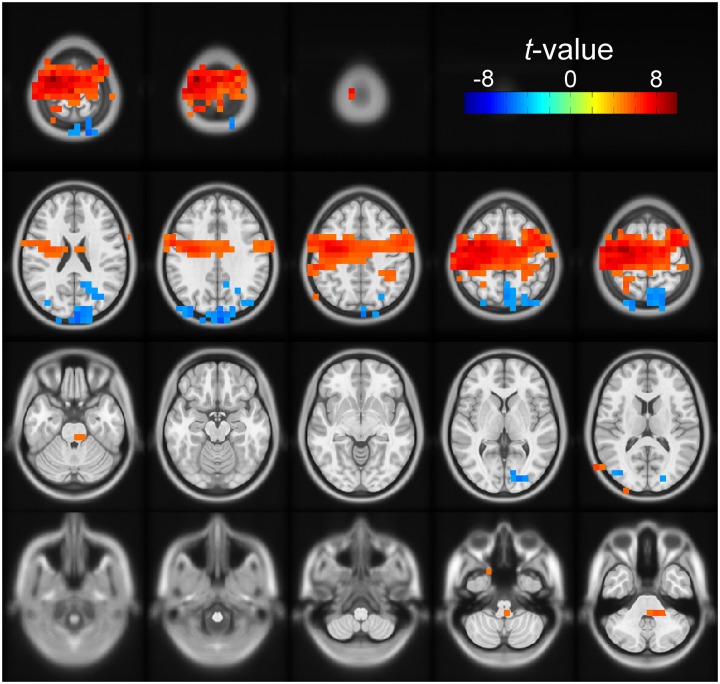
FIGURE 4.
Source space solution rendered on an MNI brain template of the dependent samples correlation between relative beta band power and number of cues. Orientation is as for the channel plots in Figure 3. The t-values of the correlation are color-coded as indicated by the scale on the top right. The figure shows the clusters of voxels with significant negative (blue) modulation during the early cue period (0–0.5 after cue onset). The negative t-values indicate that relative beta band power decreased further as the number of cues increased. These voxels were localized bilaterally but with a right preponderance, mostly on the right superior parietal cortex, the right superior occipital cortex, the right precuneus, and the left cuneus. The figure also identifies the clusters of voxels with positive modulation by number of cues during the late cue period (0.5–1 s after cue onset). The positive t-values indicate that relative beta band power decreased less as the number of cues increased. These voxels were localized bilaterally but predominantly on the left sensorimotor area.

