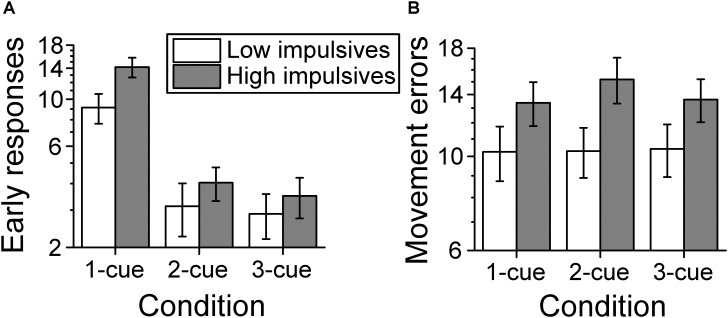
FIGURE 7.
Behavioral performance. (A) Number of early response errors per cue condition and impulsivity group. The number of early errors decreased as number of cues increased and was greater for the high impulsivity group than for the low impulsivity group. (B) Number of movement errors per cue condition and impulsivity group. The number of movement errors was not affected by number of cues but was greater for the high impulsivity group than the low impulsivity group. The ordinates are in a log scale to be consistent with the log link used with the mixed model analysis. Error bars represent the standard error of the mean (Low impulsivity N = 24; High impulsivity N = 26).

