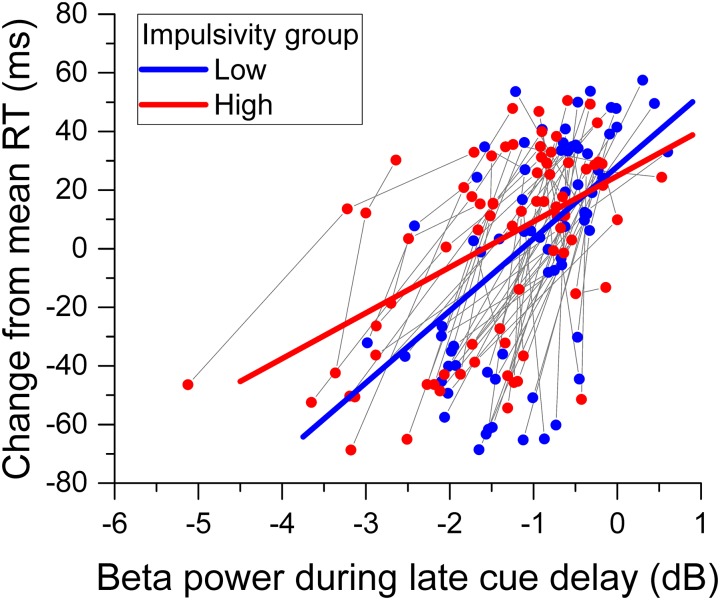
FIGURE 8.
Relation between reaction time and beta band power. The scattergram shows the change of reaction time from the mean against beta desynchronization during the late cue period, for each participant and cue condition. The data from the same participant are connected by a gray line. The straight lines through the data points represent the best fit of the model. Data from the low impulsivity group are in blue, those from the high impulsivity group are in red.

