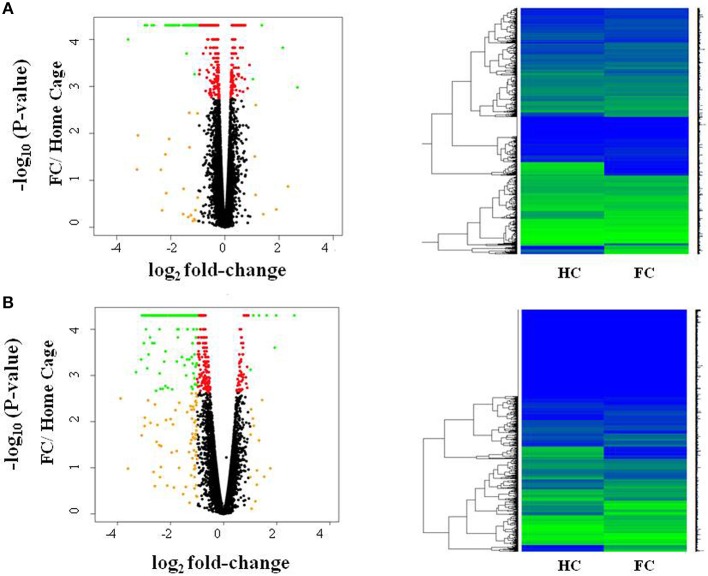
Figure 1.
Fear conditioning induces gene expression differences in amygdala and blood. Volcano plots and heatmaps show changes in gene expression in the amygdala (A) and blood (B) after fear conditioning compared to Home Cage (HC vs. FC). The horizontal axis of the Volcano plot is log2 fold change for differently expressed genes, and the vertical axis is the negative-log10 of the p-values are plotted. Each dot represents a gene, with red dots showing genes reaching an FDR corrected p-value of 0.05, and green dots representing genes with FDR < 0.05 and absolute fold change >1; orange dots have an absolute fold change>1 but do not reach experiment-wide significance; black dots are genes whose expression is similar between the two groups.

