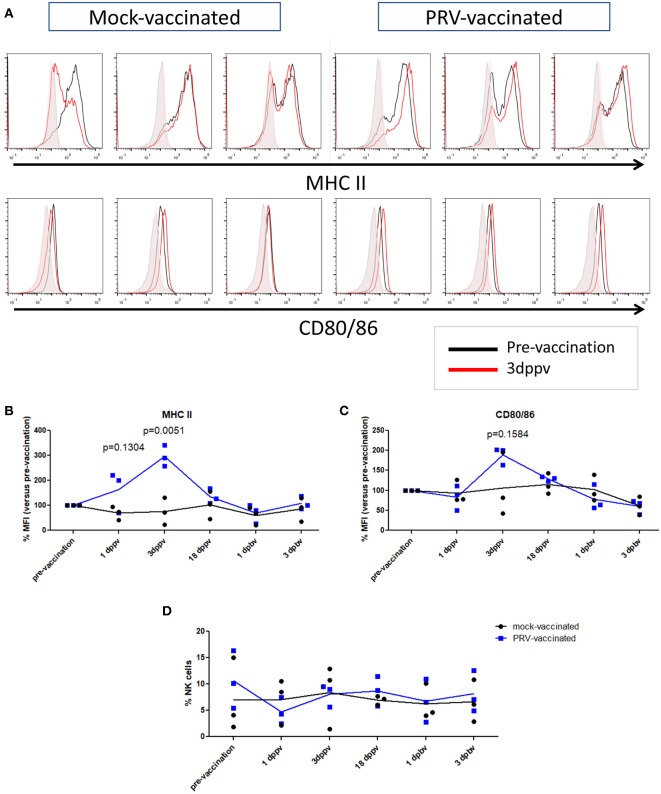
Figure 3.
MHC II and CD80/86 expression on porcine NK cells before vaccination and after primary and booster vaccination. (A) Histograms show MHC II (upper panel) and CD80/86 (lower panel) expression on NK cells within the PBMC population before vaccination (pre-vaccination) and 3 days post primary vaccination (dppv). An overlay of the signals (pre-vaccination: black open histogram; 3 dppv: red open histogram) and isotype controls (pre-vaccination: gray shaded histogram; 3 dppv: red shaded histogram) of three mock-vaccinated animals (left) and three PRV-vaccinated animals (right) is shown. Graphs show MFI values of MHC II (B) and CD80/86 (C) expression on porcine NK cells before vaccination, 1, 3, and 18 days post primary vaccination and 1 and 3 days post booster vaccination. The MFI value of the time point before vaccination was set to 100% and the following time points were compared with the time point before vaccination. (D) Dot plot shows the percentage of NK cells within the PBMC population before vaccination, 1, 3, and 18 days post primary vaccination and 1 and 3 days post booster vaccination. Dot plot shows the results of three animals of each group (mock-vaccinated and PRV-vaccinated group) and the mean values are connected with a line. P-value threshold for statistically significant differences was 0.05, p-values are indicated in the graphs (dppv, day(s) post-primary vaccination; dpbv, day(s) post-booster vaccination).

