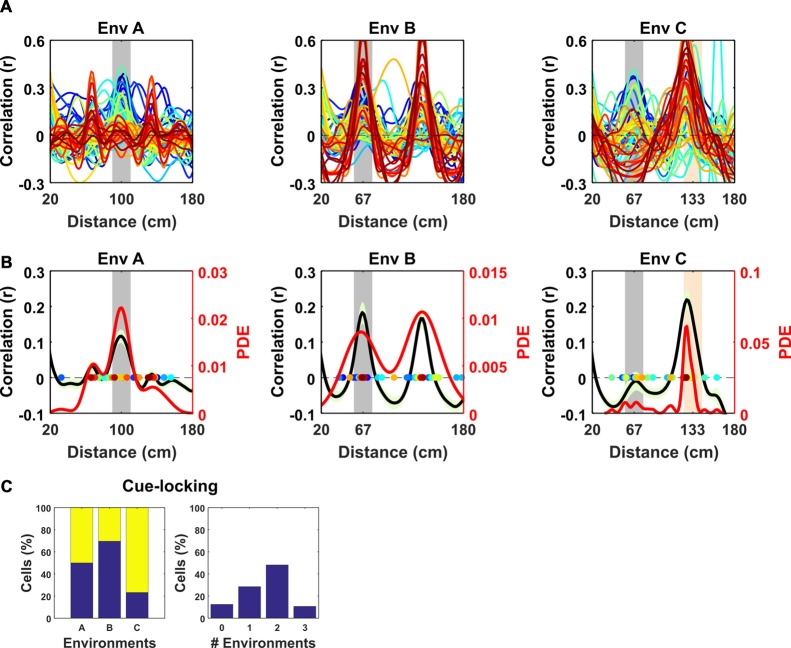
Figure 3.
Spatial frequency of the periodic non-grid cells. Within VR environments, periodic non-grid cells exhibited regular firing at the same spatial frequency as the underlying repetitive visual cues, unlike grid cells which showed weaker spatial periodicity of varying frequencies. (A) SAC of all non-grid periodic cells across VR environments. Note the clear peaks centered on the spatial frequency of the repeating cues of each environment (gray block for Environment A and B and gray and orange in Environment C). (B) Mean (black line) ± SEM (light green shaded area) of the SAC (left y-axis) across cells within each environment showing clear coincidence with the frequency of the repetitive cues (gray block). Colored dots indicate the dominant spatial frequency of each cell (color matches lines in A) and were used to compute the kernel density estimate (red line, right y-axis). (C) Histograms showing (left) percentages of non-cue locked (blue) and cue-locked (yellow) periodic cells within each VR environment. Right, Histograms showing percentages of periodic cells exhibiting cue locking in multiple environments. Most cells (>85%) displayed cue-locking in at least one VR environments.

