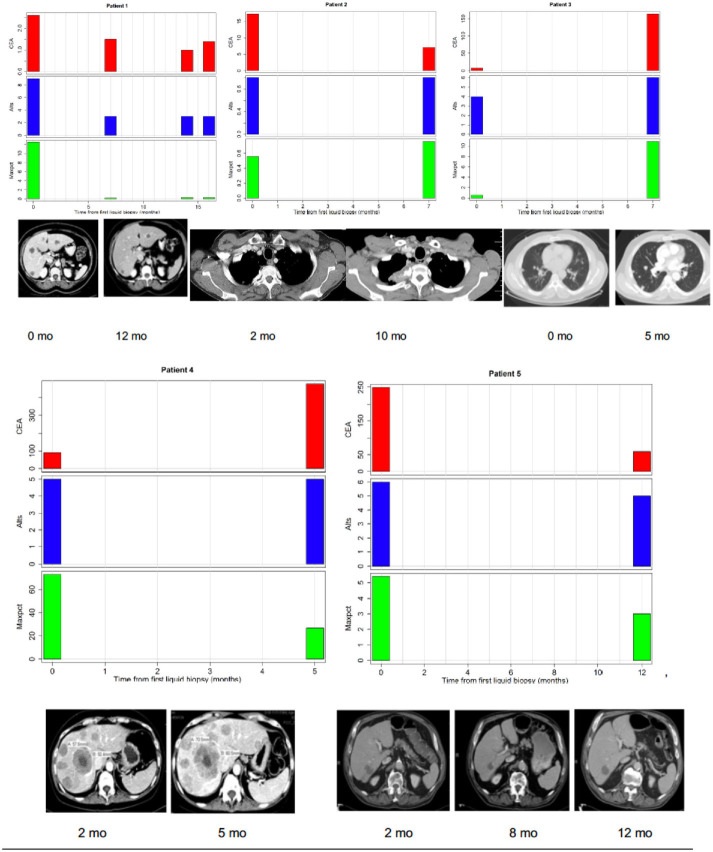
Figure 3.
Correlations between tumor burden as assessed by radiographic imaging (CT scans) or CEA (tumor marker) and liquid biopsy mutation parameters (alts or number of alterations/number of mutated genes and maxpct or maximal allele frequency of mutated allele). (Top Left) Maxpct, CEA, and alts follow a downward trend as disease on CT scan improves. Center: With growth of mediastinal mass on CT, note rise in maxpct, CEA, and alts. (Top Right) As lung disease worsens on CT, maxpct, CEA, and alts increase. (Bottom Left) Despite increasing tumor on CT scan and rising CEA, maxpct did not rise. Liquid biopsy did contain APC and TP53 mutations, indicating presence of ctDNA. (Bottom Right) Liver metastases decreased between 1/2017 and 7/2017 and then increased in 11/2017. Allele freq. low (24%) probably due to low disease burden on CT.

