
Figure 4.
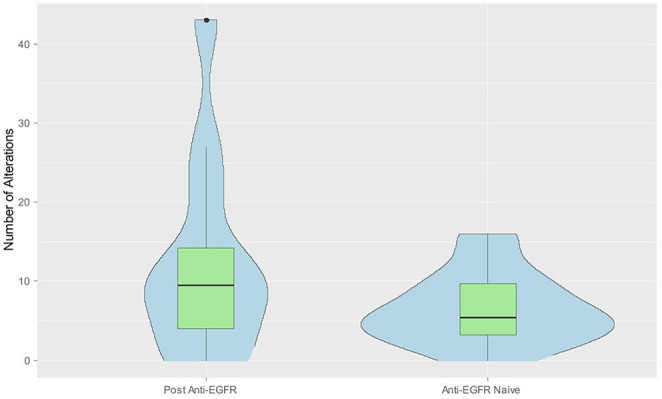
Combined violin and box plot graph demonstrating increased number of alts in liquid biopsy post anti-EGFR therapy. Data from the blood sample collected at time of disease progression was selected when multiple measurements were available from the same patient. Median number of alts were higher post anti-EGFR (n = 12) vs. anti-EGFR nave liquid biopsy (n = 22) (9.5 vs. 5.5, p = 0.058).