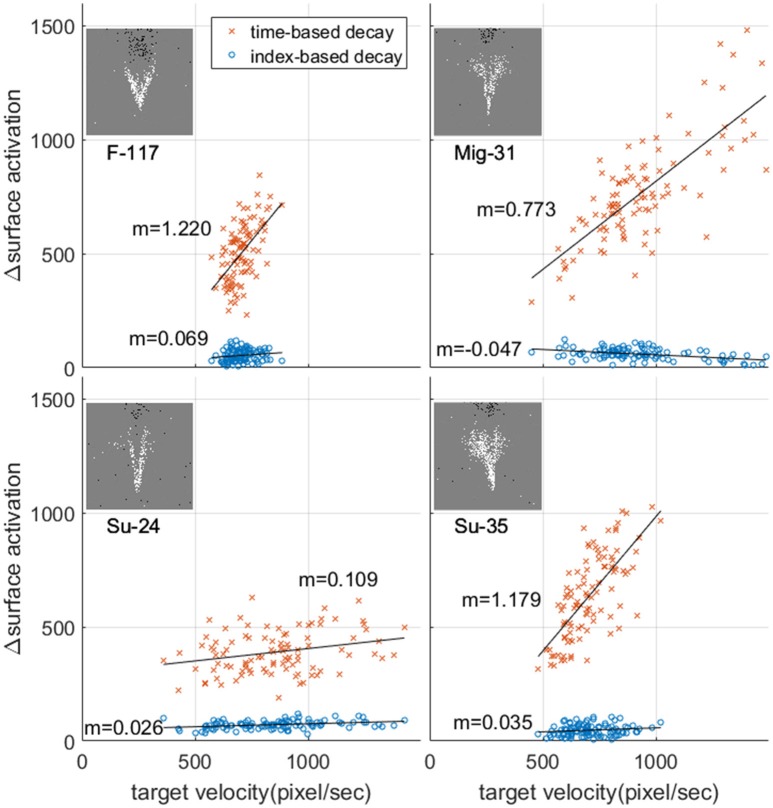
Figure 7.
Relationship between change in surface activation and target velocity and the resultant mean rate of change in surface activation. Each point represents a single recording in the dataset. The mean value of target velocity and change in surface activation was calculated over the time window indicated in Figure 6 (A). For each panel m indicates the slope of the line of best fit.

