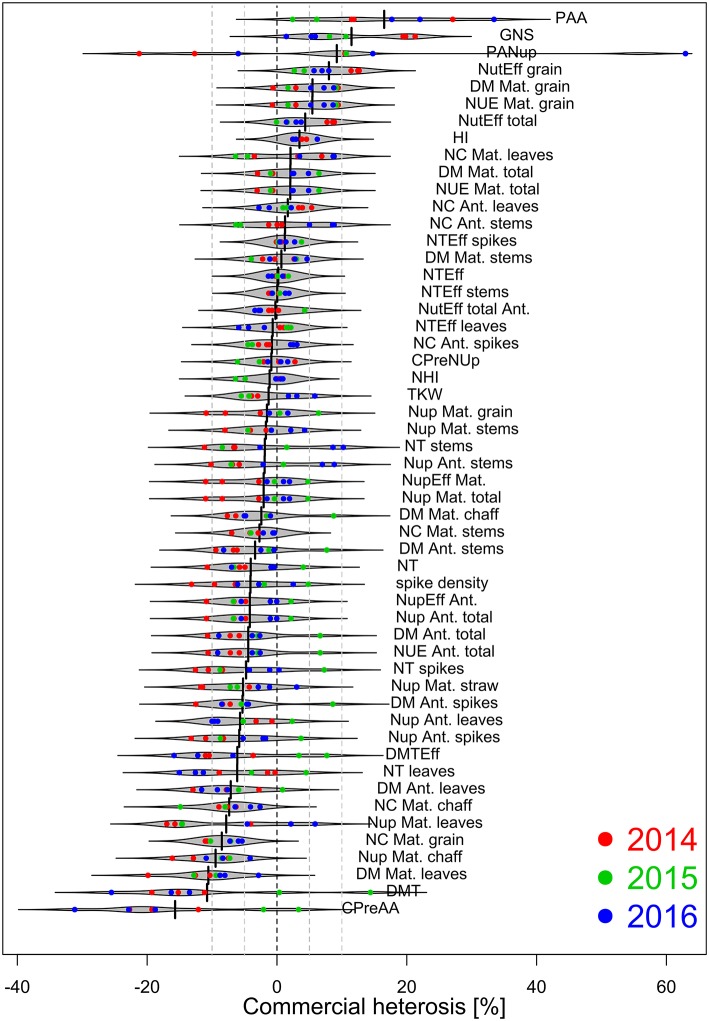
Figure 5.
Commercial heterosis [%] by traits based on estimated marginal means within year*N-level combinations (n = 8), sorted descending. Heterosis estimates are colored by years. Negative and positive values indicate on average lower and higher trait values for hybrids than for lines, respectively. Dashed lines indicate values of 0, ± 5 and ± 10%, respectively.

