Fig. 1.
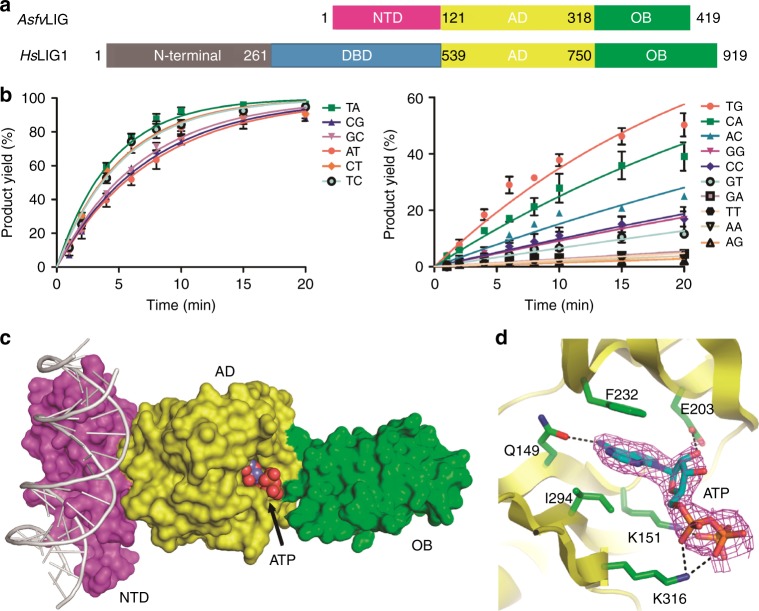
Domain architecture and ATP recognition pattern of AsfvLIG. a Schematic view comparing the domain compositions of AsfvLIG and HsLIG1. b In vitro DNA ligation catalyzed by wild-type AsfvLIG. Data represent the mean of three independent experiments, the standard deviation (SD) values are indicated by error bars. c Overall fold of the non-catalytic AsfvLIG:DNA complex. AsfvLIG is shown as surface with the NTD, AD, and OB domains colored in magenta, yellow, and green, respectively. DNA and ATP are shown as cartoons and spheres in white and atomic colors (C, light-blue; N, blue; O, red; P, orange), respectively. d Cartoon-and-stick view showing ATP recognition by the AsfvLIG AD domain. ATP is shown as sticks and outlined with simulated annealing 2Fo-Fc omit map, which is contoured at the 1.5 sigma level

