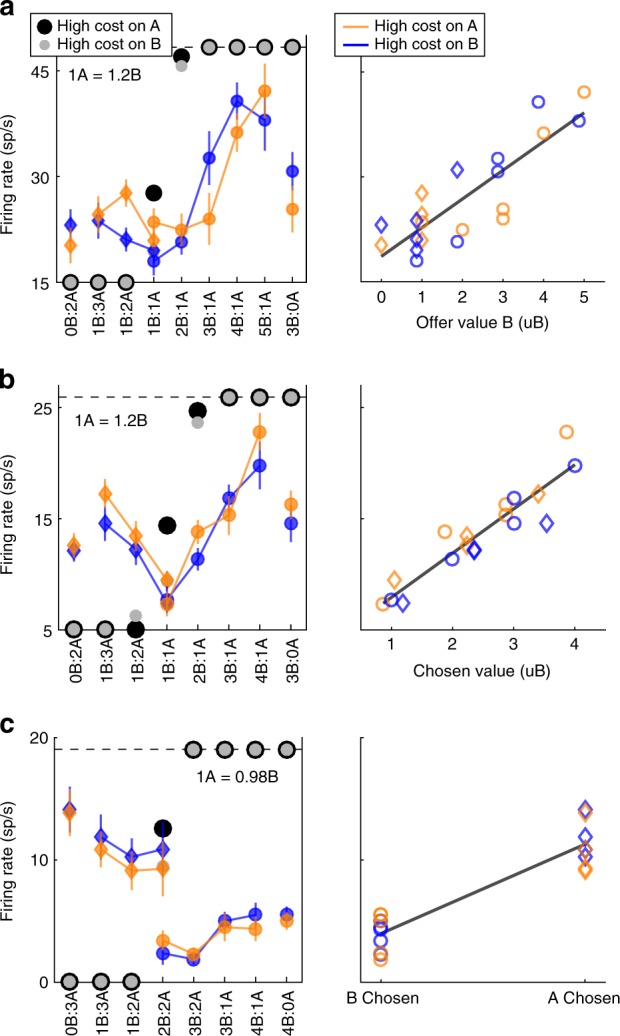
Fig. 2.

Encoding of decision variables in juice-based reference frame. a Neuronal response encoding the variable offer value B (post-offer time window). In the left panel, the x axis represents different offer types ranked by the ratio #B:#A. Black and gray symbols represent the percentage of B choices measured for A−:B + trials and A + :B− trials, respectively. Color symbols represent the neuronal firing rate, with diamonds and circles, indicating trials in which the monkey chose juice A and juice B, respectively. Blue and orange indicate A + :B− trials and A−:B + trials, respectively. Error bars indicate SEM. In the right panel, the same neuronal response is plotted against the variable offer value B. The black line is derived from a linear regression (R2 = 0.73). b Response encoding the chosen value (late-delay time window). In the right panel, the response is plotted against the variable chosen value expressed in units of juice B. The black line is derived from a linear regression (R2 = 0.86). c Response encoding the chosen juice (post-offer time window). In the right panel, the black line is derived from a linear regression (R2 = 0.85). All conventions in b and c are as in a
