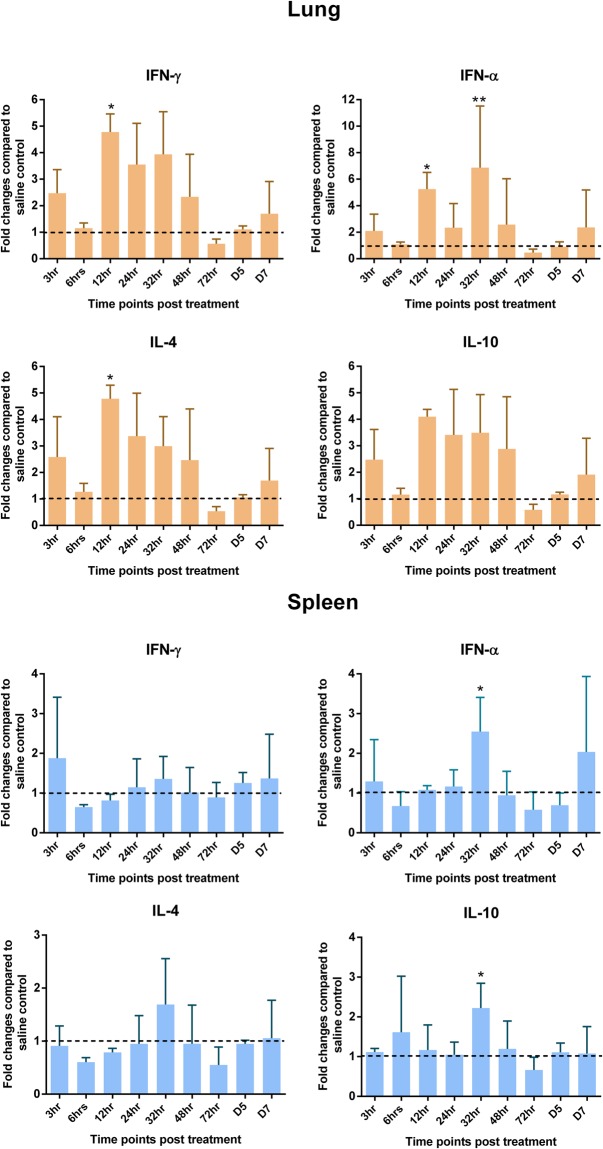
Figure 3.
Interferon and regulatory cytokine profile in lung and spleen. MFI of each gene was normalized to the average of HKGs – (Hprt 1 and Tubb 1), then fold changes were calculated against the saline control at each time point and the means were graphed. (Dotted line shows a fold change of one, which indicates no change compared to the control group and the vertical line and horizontal bar show the standard error of mean-SEM). Dunnett’s test following ANOVA testing was used to test for significant differences of gene expression between CpG-ODN group and the saline control group at each time point. Asterisks indicate groups that were significantly different from control group, *P < 0.05 and **P < 0.01.

