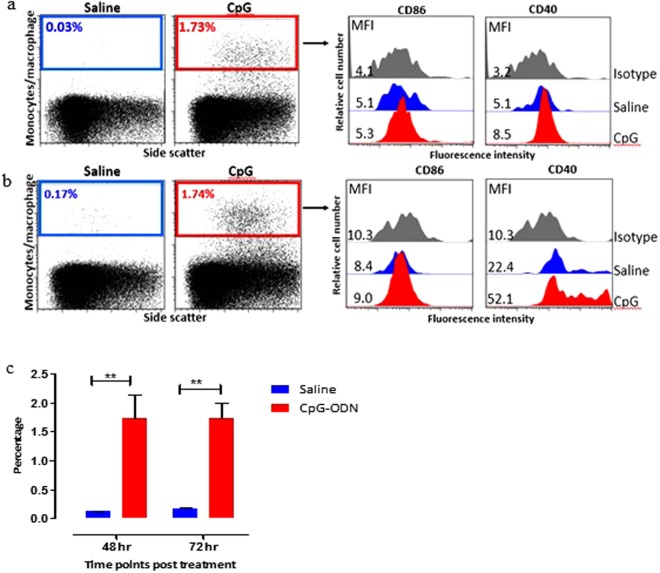
Figure 5.
Flow cytometric analysis of lung cells 48 (a) and 72 hrs (b) post in-ovo injections. (Day 20 and 21 embryo). Macrophages were analyzed (left panels) by gating on monocyte/macrophages population based on forward and side scatter plot. Histogram panels on right indicate the level of CD86 and CD40 (costimulatory molecules found on APCs) expression on the APCs. (c) Bar diagram show the mean percentages of monocyte/macrophage APCs following in-ovo treatment in lung. vertical line and horizontal bar show the standard error of mean SEM, n = 3–4. Two way ANOVA following Bonferroni post-test was done to compare means of APC percentages of CpG-ODN received groups with saline control. Asterisks indicate significant differeces between the groups, **P < 0.01.

