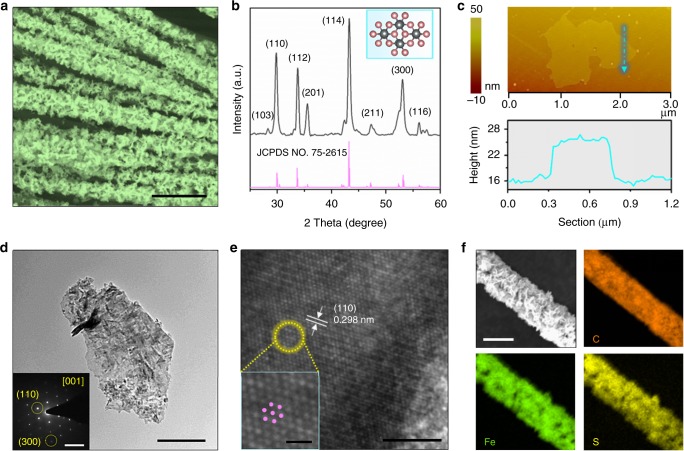
Fig. 1.
Characterization of ultrathin troilite FeS nanosheets. a FE-SEM image of FeS nanosheets grown on CFC (scale bar, 50 μm). b XRD patterns of FeS nanosheets. Inset: atomic structural model. c Top panel: AFM topographical image of a FeS nanosheet. Bottom panel: height profile of a FeS nanosheet is marked by arrow line. d TEM image of a FeS nanosheet (scale bar, 0.4 μm). Inset: the SAED pattern. e HR-TEM image of a FeS nanosheet (scale bar, 5 nm). Inset: the enlarged image (scale bar, 1 nm). f EDS mapping of FeS nanosheets grown on one carbon fiber (scale bar, 10 μm)

