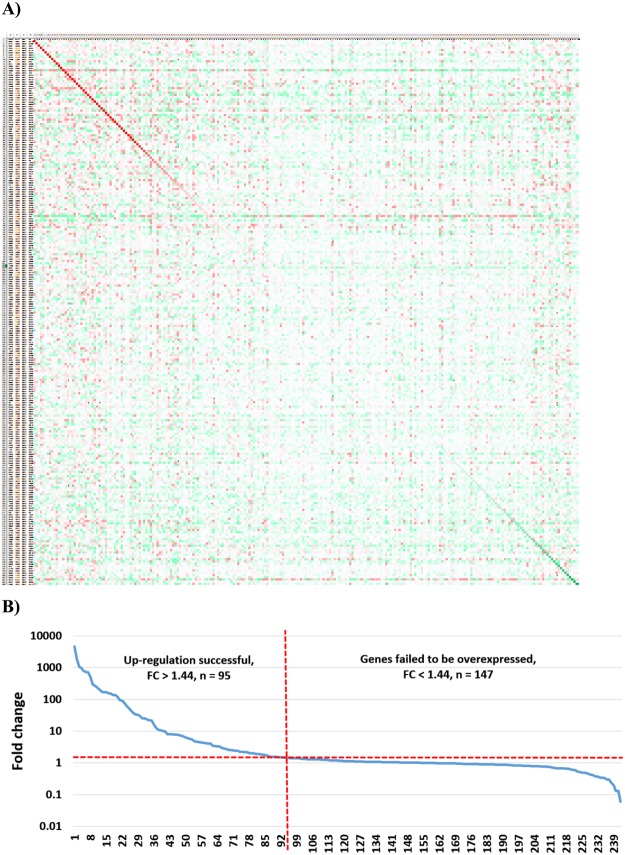
Figure 2.
Efficacy of overexpression across all genes. Heat map demonstrating the efficacy of gene overexpression across all experiments (A). Columns are overexpressed genes and the rows are experiments. Green color refers to lower, while red means higher expression in the treated sample compared to control. Genes and experiments are ranked so that the diagonal (red) line corresponds to the overexpression efficacy of the targeted gene in the particular experiment. A ranked order of all genes based on fold change (B). Values below one indicate down-regulation, values over one indicate up-regulation. The dotted red line shows 1.44x fold change. Robust gene induction was confirmed in 39% of all genes.

