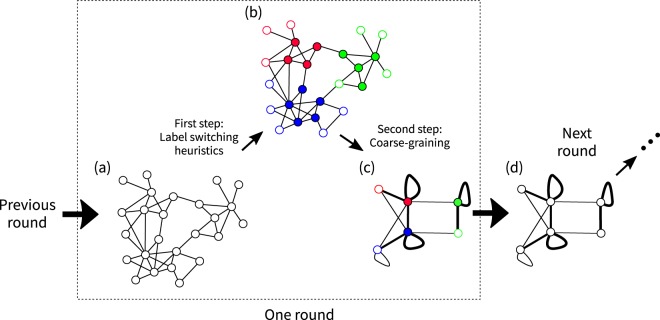
Figure 10.
Schematic illustration of the variant of the Louvain algorithm. At the beginning of the current round, we have an input network of nodes (i.e., (a)). In the first step, we detect CP pairs in the input network using a label switching heuristic (i.e., (b)). In the second step, we construct a coarse-grained network by contracting the nodes in the input network having the same label into a super-node (i.e., (c)). Then, we perform the next round of which the input network is the coarse-grained network of the current round (i.e., (d)). We iterate the rounds until the value of stops increasing. (a) Input network for the current round. (b) CP pairs detected in the first step. The colour of each node indicates the CP pair to which the node belongs, i.e., ci (1 ≤ i ≤ N). The filled and blank circles indicate core and peripheral nodes, respectively, i.e., xi. (c) Coarse-grained network constructed in the second step. The colour and openness of circles indicate the label (ci, xi) of super-node i. The thickness of the edge between super-nodes indicates the weight of the edge, i.e., the sum of the weight of the edges between a node in the input network belonging to one super-node and a node in the input network belonging to the other super-node. (d) The input network for the next round.

