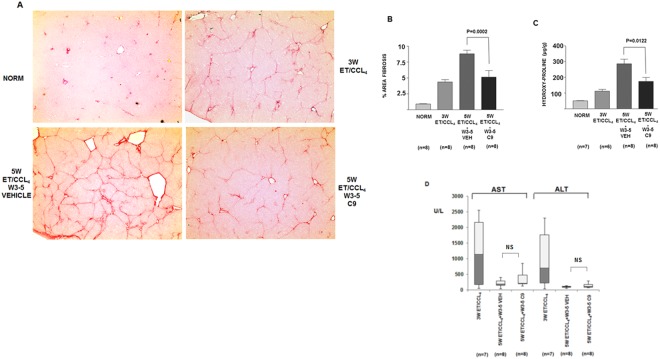
Figure 8.
Treatment of CCl4/ethanol induced hepatic fibrosis by C9. (A) Representative images of Sirius red staining of liver sections, the same magnification as in Fig. 7 (additional images are shown in the supplemental material). Upper left panel: normal liver. Upper right panel: fibrosis after 3 weeks of CCl4/ethanol administration. Lower left panel: fibrosis after 5 weeks of CCl4/ethanol administration in an untreated animal. Lower right panel: fibrosis after 5 weeks of CCl4/ethanol administration in an animal treated from week 3 to week 5 with C9. (B) Quantification of fibrosis. Left panel: morphometric quantification of fibrosis area from Sirius red stained histological slides. Significant reduction of fibrosis between nontreated and treated animals is indicated (p = 0.0002, unpaired t test). (C) Determination of hydroxy-proline content of the livers (p = 0.0122, unpaired t test). Number of animals in each cohort is specified. Error bars: +−SEM. (D) Aspartate aminotransferase (AST) and alanine aminotransferase (ALT) were measured in plasma of the indicated cohorts of animals. Box plots showing median, first quartile, third quartile and minimal and maximal values are shown.

