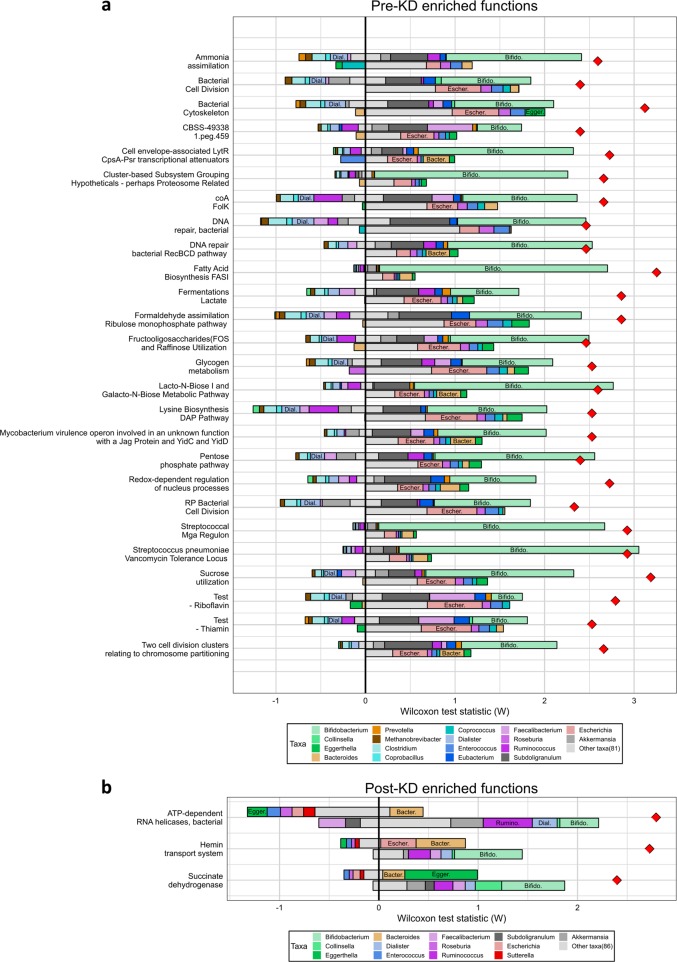
Fig. 4.
Taxonomic drivers of functional shifts associated with KD. Taxonomic contributions to the shift in each function are shown as bars for functions enriched pre-KD compared to post-KD a and functions enriched post-KD compared to pre-KD b. Bar length represents the size of the contribution. For each function, the position of the bar indicates the type of contribution. The top (bottom) bars represent contributions from genera with higher (lower) relative abundance in the enrichment group (pre-KD for a, post-KD for b). Bars to the left (right) of the vertical black line represent contributions to decreased (increased) function abundance in the enrichment group. The red diamonds indicate the observed increase in relative median function abundance in pre-KD samples a or post-KD samples b. Colors indicate the genus, with genera from the same phylum sharing similar colors: green for Actinobacteria; orange for Bacteroidetes; teal, blue, and purple for Firmicutes; and red for Proteobacteria. Genus labels within bars are provided for genera with notable contributions where bars were wide enough to accommodate labels

