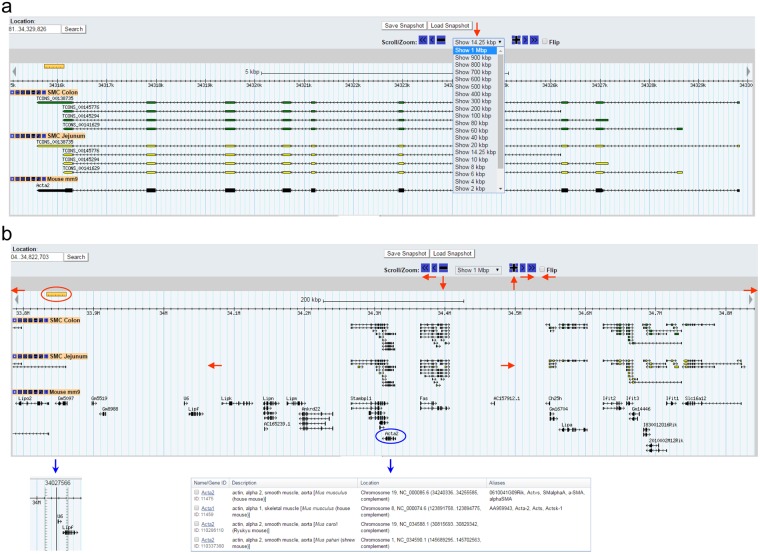
Figure 2.
A map view of Acta2 transcripts in the genome. (a) Zooming capabilities range from 1 Mbp to 100 bp at the Acta2 locus (red arrow). (b) A genomic view of 1 Mbp around the Acta2 gene locus. This map view can be freely moved left (←), or right (→) in the genome by the “Scroll/Zoom” menu options of “≪”, “<”, “◄”, “≫”, “>”, or “►”. Zoom is controlled by “−” or “+” or out (↓) and in (↑). “Flip” allows the user to switch between sense strand to anti-strand view or vice versa. Reference genes on the view are linked to the NCBI (Acta2, encircled in blue, is linked to reference genes at the NCBI). The ruler on left can be moved and denotes an exact chromosomal location of the cursor.

