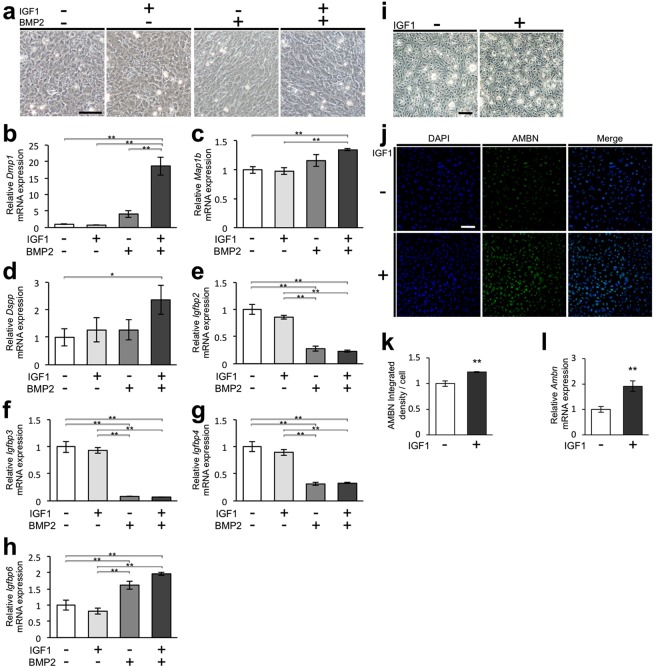
Figure 8.
IGF1 stimulates the differentiation of mesenchymal and epithelial cells derived from tooth germs. (a) Phase-contrast images of mesenchymal cells isolated from the mandibular molar tooth germ of ED14.5 mice at day 10 of culture in the control, IGF1-treated, BMP2-treated, and IGF1 plus BMP2-treated groups. Scale bar, 100 µm. mRNA expression levels of Dmp1 (b), Map1b (c), Dspp (d), Igfbp2 (e), Igfbp3 (f), Igfbp4 (g) and Igfbp6 (h) were quantitatively analysed by real-time PCR. Error bars indicate the standard deviation (N = 3). *p < 0.05, **p < 0.01 (one-way analysis of variance followed by the Tukey-Kramer test). (i) Phase-contrast images of epithelial cells isolated from the mandibular molar tooth germs of ED14.5 mice at day 4 of culture in the control and IGF1-treated groups. Scale bar, 200 µm. (j) Expression of AMBN (green) in the dental epithelial cells was analysed by immunofluorescence. Nuclei were stained with DAPI (blue). Scale bar, 100 µm. (k) The immunofluorescent signal of AMBN was quantitatively analysed. Data are expressed as integrated density/cell. Error bars indicate the standard deviation (N = 3). **p < 0.01 (versus control group; Student’s t-test). (l) The Ambn mRNA expression was quantitatively analysed by real-time PCR. Error bars indicate the standard deviation (N = 3). **p < 0.01 (versus control group; Student’s t-test).

