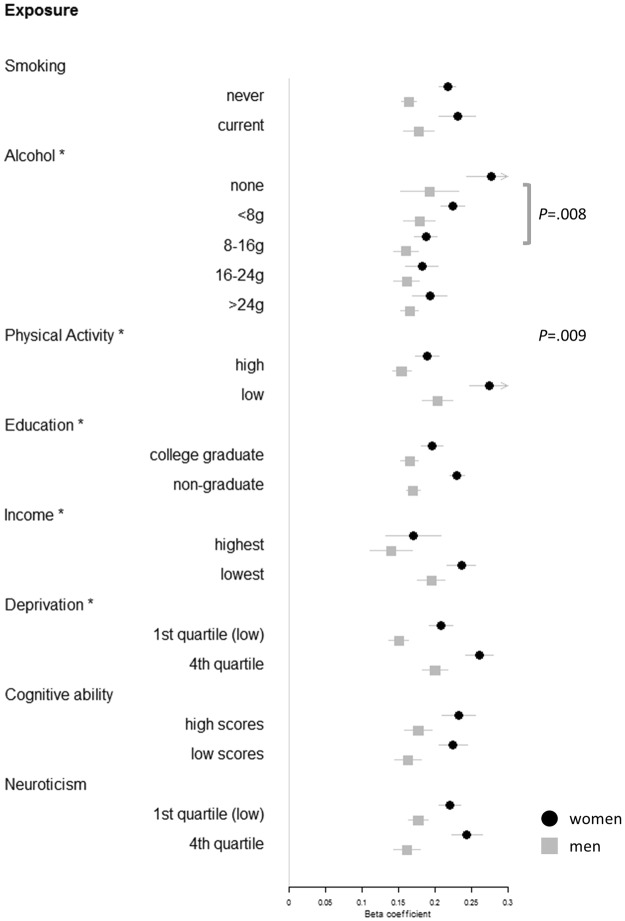
Figure 1.
Forest plot showing a one SD change in adult BMI according to a one SD increase in BMI PGS, by strata of lifestyle and psychosocial factors, and by sex. Beta coefficients and 95% confidence intervals derive from models that include age, age2, genetic batch, genetic array, assessment centre, and 10 principal components of population structure. Asterisks indicate significant two-way interactions (PGS*Exposure) in predicting BMI in the total sample. P-values show significant three-way interactions with sex (Sex*PGS*Exposure).

