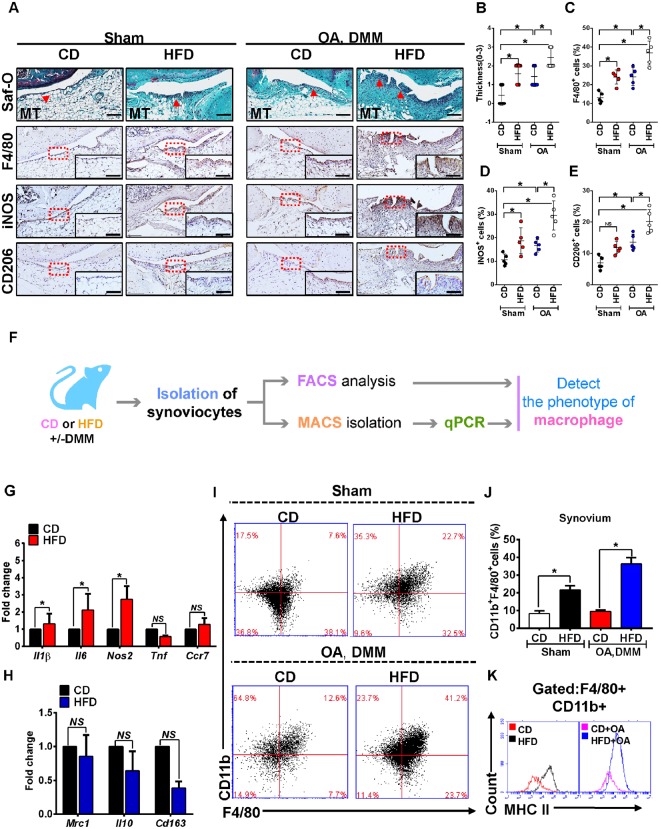
Figure 3.
Inflamed synovium expresses a dominant M1 signature during the challenge of High-fat diet. (A)Top panel: Representative Safranin O and fast green stained sagittal sections of sham or experimental OA knee regions in mice fed a CD or HFD diet. Scale bars, 100 µm. Bottom panel: Similar sections were stained with F4/80, iNOS, and CD206 to determine the phenotype of synovial macrophage in activated synovium from CD- or HFD-fed mice. Scale bars, 100 µm. Insets are enlarged images of stained sections. (B) Synovial inflammation was assessed using synovitis scoring based on degree of cell thickness in the synovial lining layer and cell density of the synovial stroma. Graphs represent mean ± SD (n = 7). *p < 0.05. (C–E)The percentage of F4/80 (C), iNOS (D), and CD206 (E) - positive cells per knee section were counted. Graphs represent mean ± SD (n = 5). *p < 0.05. (F) Schematic diagram showing the experimental procedure, from the isolation of synoviocytes from animals to analyse the phenotype of synovial macrophage in the synovium from multiple biopsies of CD- and HFD-fed mice. qPCR analysis of pro-inflammatory M1-like (G) or anti-inflammatory M2-like (H) genes in MACS isolated F4/80+ synovial macrophage from CD- or HFD-fed mice. (I–J) FACS analysis of synovial macrophage from CD- or HFD-fed mice. (K)Same biopsies were further stained with MHC II to analyse the population of M1 activated macrophage. Saf-O: Safranin O and fast green staining; MT: medial tibia.

