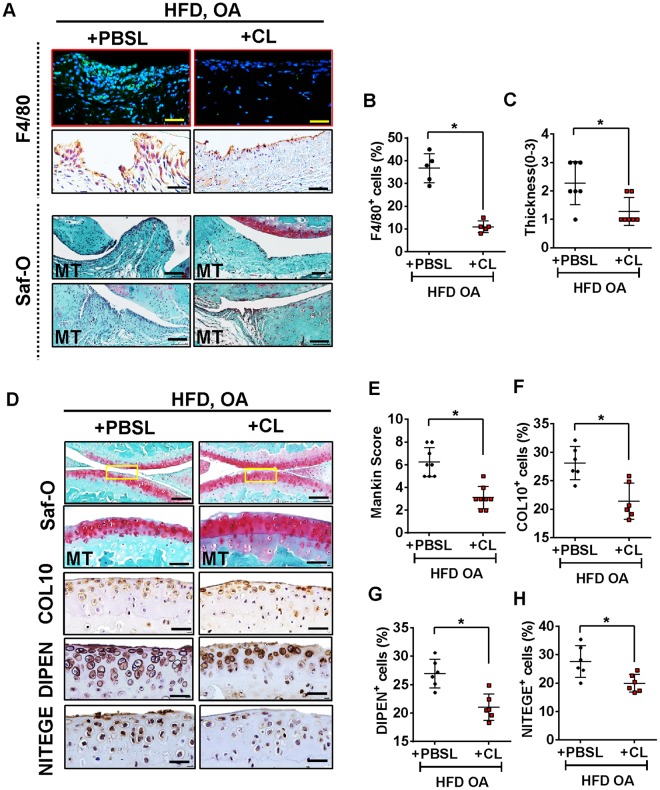
Figure 4.
Clodronate liposome attenuates cartilage damage and synovial inflammation induced by High-fat diet in post-traumatic OA model. (A) Top panel: Knee sections were stained with F4/80 to determine the effect of Clodronate liposome on synovial macrophages. Scale bars, 100 µm. Bottom panel: Representative safranin-O image showed treatment effects from Clodronate liposome in the synovium of HFD-fed mice with surgically-OA. Scale bars, 100 µm. (B) The percentage of F4/80-positive cells per knee section were counted. Graphs represent mean ± SD (n = 5). *p < 0.05. (C) Synovial inflammation was assessed using synovitis scoring based on degree of cell thickness in the synovial lining layer and cell density of the synovial stroma. Graphs represent mean ± SD (n = 7). *p < 0.05. (D) Top panel: Representative Safranin O and fast green stained sagittal sections of experimental OA knee regions in mice fed HFD diet after Clodronate liposome treatment. Scale bars, 100 µm. The inset boxes in upper re shown at higher resolution in lower panels. Scale bars, 100 µm. Bottom panel: Similar sections were stained with COL10, DIPEN, and NITEGE to determine if Clodronate liposome attenuated cartilage damage. Scale bars, 100 µm. (E) Severity of articular cartilage degradation was graded using Mankin scoring system. Graphs represent mean ± SD (n = 8 ). *p < 0.05. (F-H) The percentage of COL10 (F), DIPEN (G), and NITEGE (H) - positive cells per knee section were counted. Graphs represent mean ± SD (n = 6). *p < 0.05. PBSL: PBS liposome; CL: Clodronate liposome. Saf-O: Safranin O and fast green staining; MT: medial tibia.

