Figure 1.
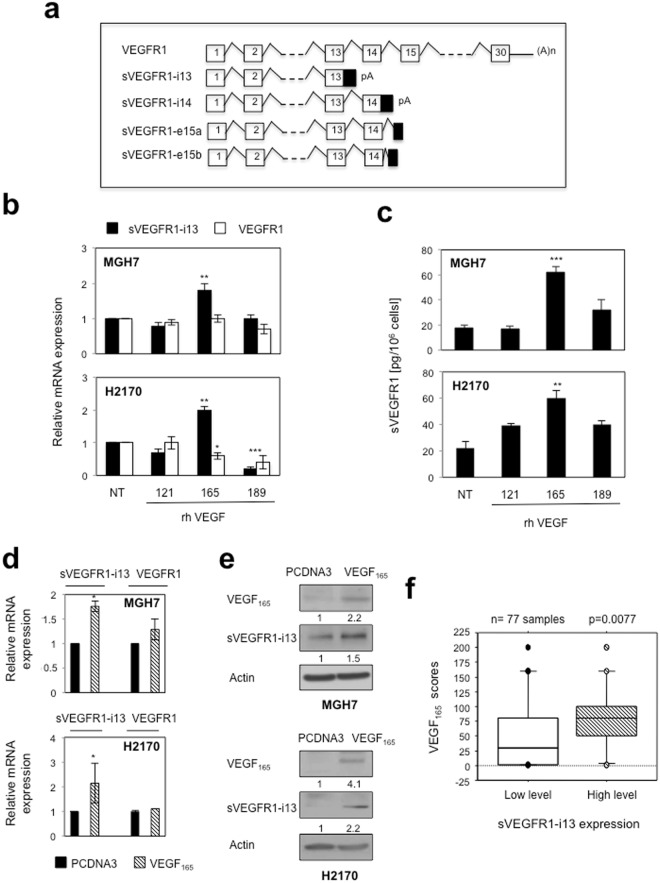
VEGF165 regulates sVEGFR1-i13 expression in SQLC cell lines. (a) Schematic representation of the full-length VEGFR1 transcript and the different sVEGFR1 splice variants. (b,c) MGH7 (upper histogram) and H2170 (lower histogram) cells treated or not (NT) with 1 ng/ml rhVEGF121, rhVEGF165 or rhVEGF189 during 24 hours. (b) RT-qPCR analyses of sVEGFR1-i13 or VEGFR1. GAPDH was used as an internal control. The value 1 was arbitrarily assigned to the untreated condition signal. (c) ELISA assays for quantification of sVEGFR1-i13 in the cell pellets. (d,e) MGH7 and H2170 cells were transfected with pcDNA3 or pcDNA3-VEGF165 plasmid for 48 hours. (d) RT-qPCR analyses of sVEGFR1-i13 and VEGFR1. GAPDH was used as an internal control. (e) Western-blot analyses of VEGF165 and sVEGFR1-i13 in MGH7 or H2170 cells as indicated. Actin was used as a loading control. Numbers represent the quantification of VEGF165 or sVEGFR1-i13 signal intensities relative to actin signal using Image J software. The value 1 was arbitrarily assigned to the pcDNA3 condition signal. All western blot experiments were performed at least three times. Illustrations of a representative result are presented for each condition. (f) Mean levels ± SD of VEGF165 immunohistochemical scores according to sVEGFR1-i13 status in squamous cell lung carcinoma, where SQLC are sub-divided in two classes representing tumors with high or low levels of sVEGFR1-i13 compared to normal lung tissues4. Statistical analyses were performed using a non parametric Mann-Whitney test (*p < 0.05; **p < 0.01; ***p < 0.001).

