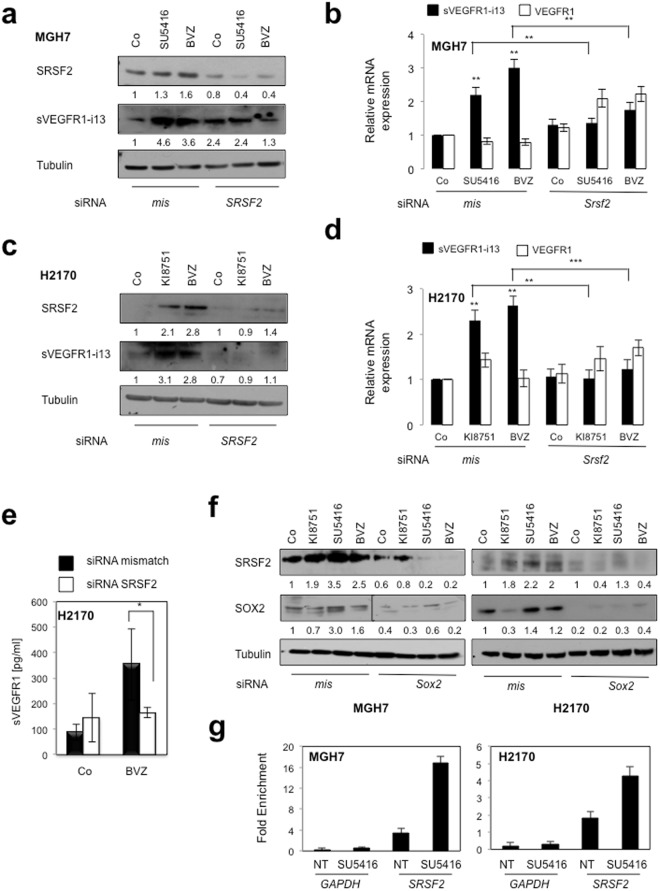
Figure 5.
SOX2 and SRSF2 control sVEGFR1-i13 expression levels in response to anti-angiogenic therapies. MGH7 (a,b,f) or H2170 (c–f) cells were transfected during 72 hours with either mismatch or Srsf2 (a–e) or Sox2 (f) siRNA and treated or not (Co) with 10 µg/ml bevacizumab, or transfected during 48 hours with either mismatch or Srsf2 (a–e) or Sox2 (f) siRNA and treated for 24 additional hours with 10 µM KI8751 or 10 µM SU5416. (a,c,f) Western blot experiments for the detection of the indicated proteins. Tubulin was used as a loading control. Quantification (numbers) as previously described. Black delineation allows to separate differential parts of the same gel. All western blot experiments were performed at least three times. Illustrations of representative results are presented for each condition. (b,d) RT-qPCR analyses of sVEGFR1-i13 or VEGFR1 mRNA level were performed in cells treated in the same conditions as in a or c, respectively. GAPDH was used as an internal control. The value 1 was arbitrarily assigned to the untreated condition signal. (e) ELISA assays for quantification of sVEGFR1 protein level in the supernatants. Statistical analyses were performed using a non parametric Mann-Whitney test (*p < 0.05). (g) Chromatin immunoprecipitation experiments were performed using an anti-SOX2 (SOX2) or an irrelevant IgG (IgG) antibody. The genomic DNA regions encompassing two potential SOX2 binding sites of the SRSF2 promoter were amplified by qPCR. The GAPDH promoter was used as a negative control. Results were normalized to input and expressed as fold enrichment compared with irrelevant antibody.

