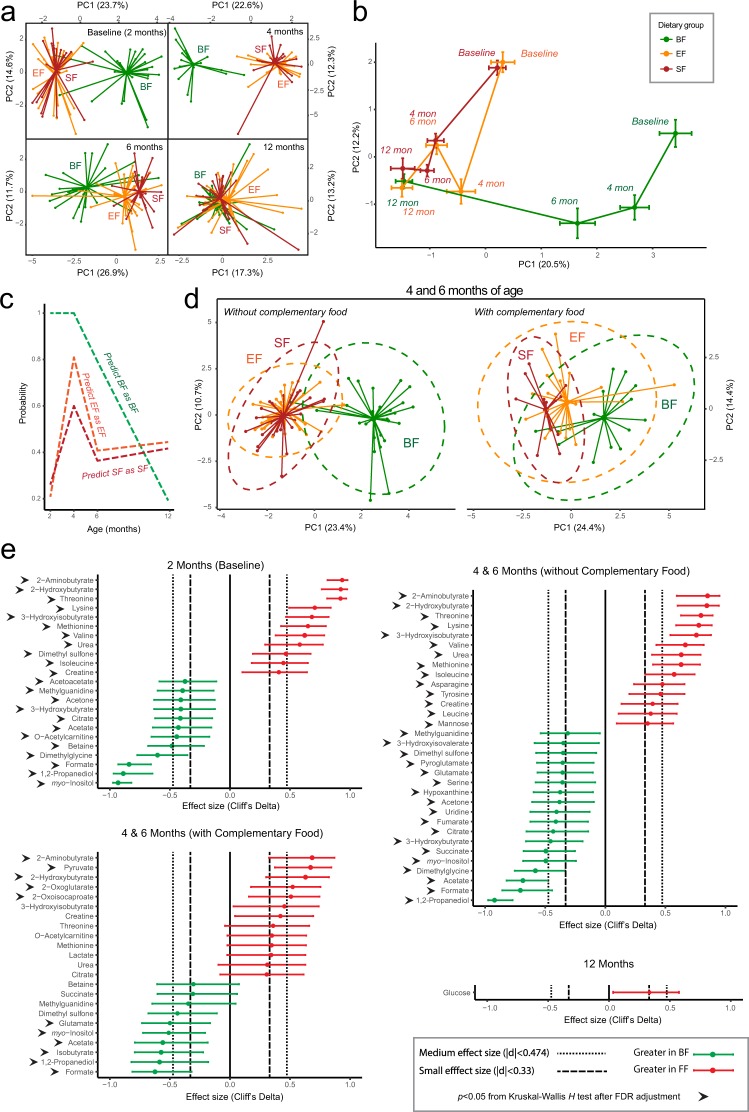
Figure 1.
Targeted serum metabolome analysis by NMR reveals differences between breast-fed (BF, green) and formula-fed (FF) (Experimental Formula, EF, orange; Standard Formula, SF, red) infants at 2, 4 and 6 months of age. (a) Principal component analysis (PCA) of generalized log transformed serum metabolite concentration data. The number of samples from each group is summarized in SI Tables 2 and 3. (b) Shifting of centroids over time from clusters in A). The centroids and the associated error bars are calculated using the average and standard deviation of PC1 and PC2 within each cluster. (c) Prediction outcome from random forest analysis. (d) PCA of infants from 4 and 6 months of age who had no/low or relatively high consumption of complementary food. The ellipses were constructed based on multivariate normal distribution at 95% confidence level. (e) NMR quantified serum metabolites significantly different between BF (green) and FF (red) infants. The 95% confidence interval was estimated using a normal distribution.

