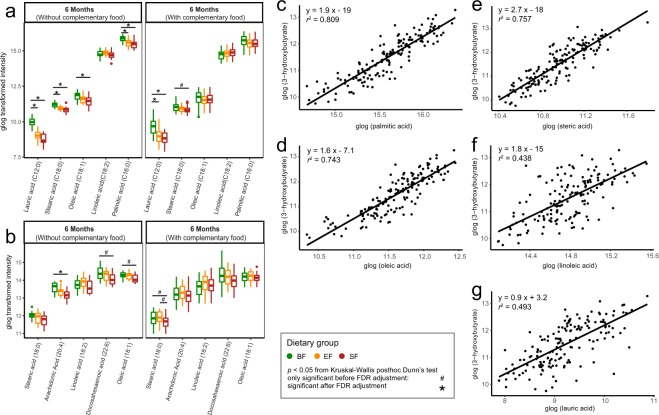
Figure 4.
Plasma free fatty acids are different between the breast-fed (BF, green) and formula-fed (Experimental formula, EF, orange; Standard Formula, SF, red) infants. The significant differences in plasma free fatty acids were measured using (a) GC-MS and (b) LC-MS metabolomics approach and evaluated using Kruskal-Wallis posthoc Dunn’s test. Correlation between the plasma levels of 3-hydroxybutyrate and the free fatty acids, (c) palmitic acid, (d) oleic acid, (e) steric acid, (f) linoleic acid, and (g) lauric acid, at 6 months of age. Data for correlation analysis was quantified using GC-MS. The association coefficient was evaluated using the square of the Pearson’s correlation coefficient (r2) and visualized via linear regression.

