Figure 2.
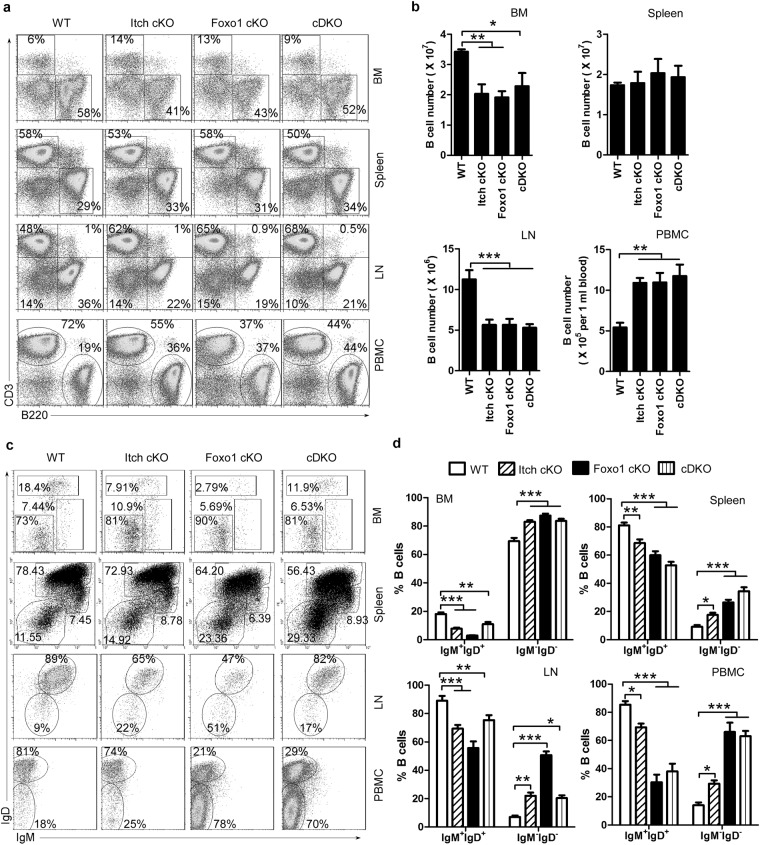
Similar abnormal B-cell development in both Itch cKO and Foxo1 cKO mice. Representative FACS profiles (a) and the absolute numbers (b) of CD3+B220− and CD3−B220+ B cells and representative flow cytometry profiles (c) and the absolute numbers (d) of IgM+IgD+B cells and IgM−IgD−B-cells in gated CD3−B220+ B cells in BM, spleen, LNs, and PBMCs from CD19creItchF/+Foxo1F/+ (WT), CD19creItchF/FFoxo1F/+ (Itch cKO), CD19creItchF/+Foxo1F/F (Foxo1 cKO), and CD19creItchF/FFoxo1F/F mice (Itch-Foxo1 cDKO) (n = 20 mice per group, 7~9 weeks old). One-way (b) and two-way (d) ANOVA plus Bonferroni post-tests to compare each column with control column. Error bars, s.e.m. *P < 0.05, **P < 0.01, ***P < 0.001.

