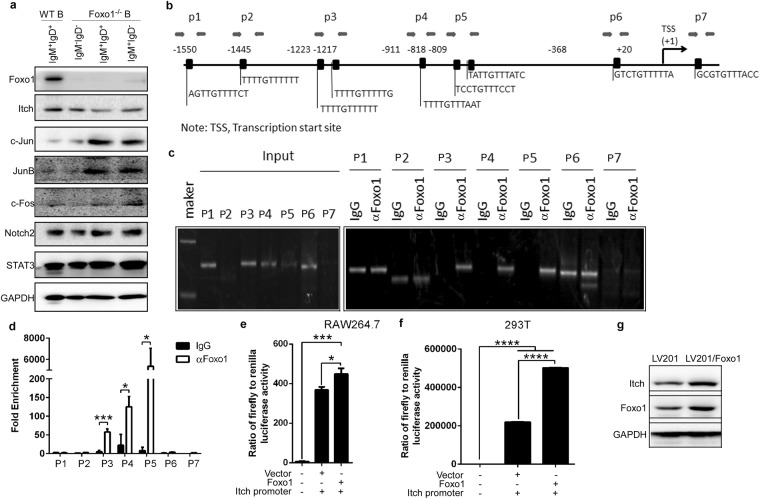
Figure 7.
Foxo1 negatively regulates JunB expression by promoting activation of the Itch promoter. (a) Immunoblot analysis of Foxo1, Itch, c-Jun, JunB, c-Fos, Notch2, and STAT3 in splenic IgM+IgD+B cells sorted from 7~9-week-old Itch cKO mice and WT littermates (n = 3 mice per group, 7~9 weeks old). (b) Schematic diagram of mouse Itch promoter region illustrating the positions of the primer pairs used for ChIP assays. Sequences represent the main predicted Foxo1 binding sites from Supplementary Tables V and VI. Arrows represent the region of the 7 primer pairs. (c,d) ChIP assays of WT B220+ B cells using a Foxo1 (αFoxo1) antibody or control IgG probing for the Foxo1 promoter locus. PCR (c) and qPCR (d) were used to analyze the enrichment and the fold-enrichments are representative of one of four independent experiments. (e,f) Empty vector Lv 201 (Vector) or Lv201/Foxo1 (Foxo1) and luciferase reporter vector pEZX-PG04.1/Itch promoter were co-transduced into RAW264.7 cells (e) or 293 T cells (f). Dual luciferase reporter gene expression was analyzed, and the results are shown as the ratio of firefly to Renilla luciferase activity. (g) Immunoblot analysis of Itch and Foxo1 in lv201 or Foxo1-expressing lv201 lentivirus-infected B cells from 7~9-week-old WT mice. (a–g) The data represent at least three independent experiments. Two-tailed student’s t-test (e,f) and two-way ANOVA plus Bonferroni post-tests (d) to compare each column with control column. Error bars, s.e.m. *p < 0.05, ***p < 0.001, ****p < 0.0001.

