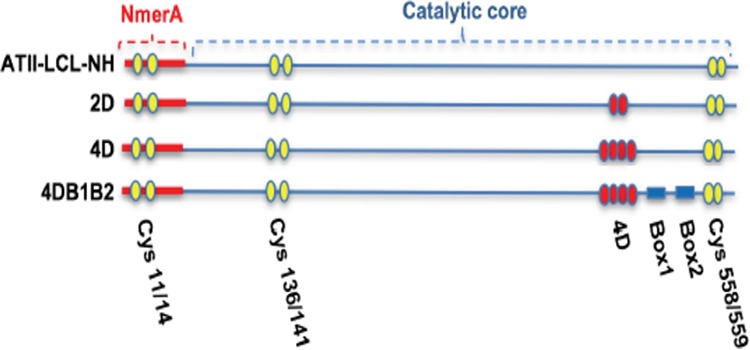
FIG 3.

Diagram of the mutations shown in Table 1. Yellow spheres represent the cysteine residues involved in binding and reduction of Hg2+; red spheres represent aspartic acid residues; blue rectangles are Box1 and Box2. For simplicity, the mutants ATII-LCL-NH/2D, ATII-LCL-NH/4D, and ATII-LCL-NH/4DB1B2 are referred to as 2D, 4D, and 4DB1B2, respectively.
