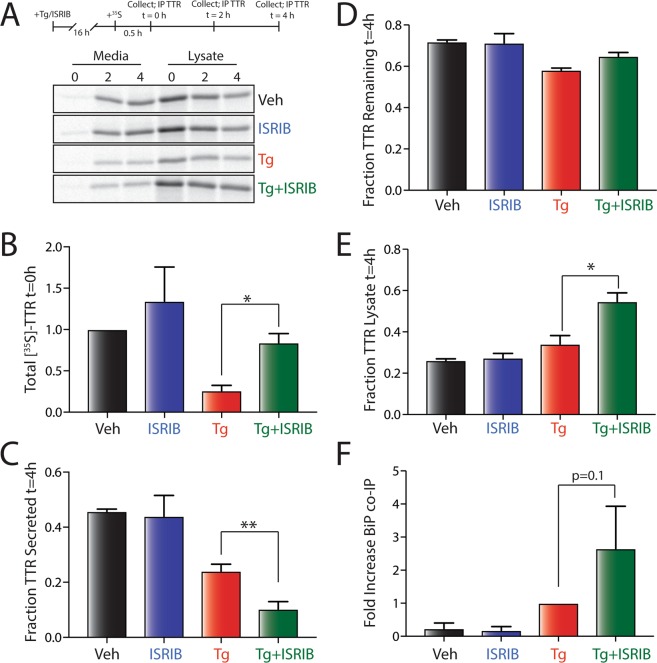
Figure 1.
Pharmacologic inhibition of PERK signaling disrupts FTTTRA25T secretory proteostasis during Tg-induced ER stress. (A) Representative autoradiogram of [35S]-labeled FTTTRA25T in lysates and media collected from HEK293T cells pretreated for 16 h with thapsigargin (Tg; 500 nM) and/or ISRIB (200 nM). The protocol for the experiment is shown above. (B) Graph showing the total amount of [35S]-labeled FTTTRA25T at t = 0 h in HEK293T cells pretreated for 16 h with thapsigargin (Tg; 500 nM) and/or ISRIB (200 nM). Data are shown normalized to vehicle-treated cells. Error bars show SEM for n = 3 independent experiments. A representative autoradiogram is shown in (A). (C) Graph showing the fraction [35S]-labeled FTTTRA25T secreted at t = 4 h in HEK293T cells pretreated for 16 h with thapsigargin (Tg; 500 nM) and/or ISRIB (200 nM). Fraction secreted was calculated as described in Materials and Methods. Error bars show SEM for n = 3 independent experiments. A representative autoradiogram is shown in (A). (D) Graph showing the fraction [35S]-labeled FTTTRA25T remaining at t = 4 h in HEK293T cells pretreated for 16 h with thapsigargin (Tg; 500 nM) and/or ISRIB (200 nM). Fraction remaining was calculated as described in Materials and Methods. Error bars show SEM for n = 3 independent experiments. A representative autoradiogram is shown in (A). (E) Graph showing the fraction [35S]-labeled FTTTRA25T in lysates at t = 4 h in HEK293T cells pretreated for 16 h with thapsigargin (Tg; 500 nM) and/or ISRIB (200 nM). Fraction lysate was calculated as described in Materials and Methods. Error bars show SEM for n = 3 independent experiments. A representative autoradiogram is shown in (A). (F) Graph showing the recovery of BiP in anti-FLAG IPs from HEK293T cells expressing FTTTRA25T and pretreated for 16 h with Tg (500 nM) and/or ISRIB (200 nM). Data are shown normalized to Tg-treated cells. Error bars show SEM for n = 3 independent experiments. A representative immunoblot is shown in Fig. S1F. *Indicates p < 0.05; ** indicates p < 0.01 for a paired two-tailed t-test.

