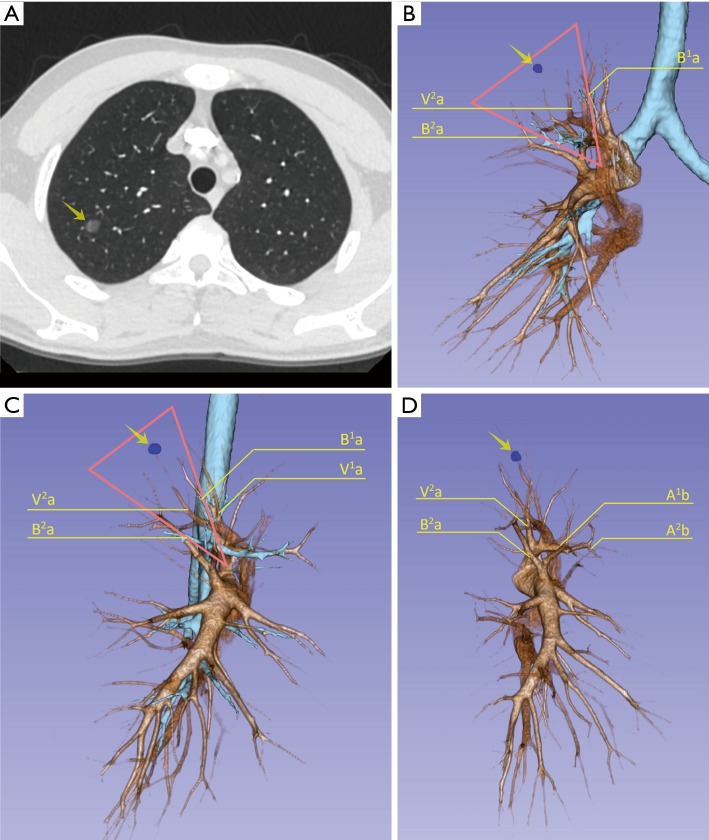
Figure 2.
The CT scan and 3D simulation of a GGO lesion in the right upper lobe. (A) CT scan showed a GGO lesion (yellow arrow) in the right upper lobe; (B) anterior view of the 3D simulation image showing the lesion between the S1a and S2a. Apical vein without central vein: V1 and V2 form common branch; (C) lateral view of the 3D simulation image showing the lesion between the S1a and S2a; (D) branches of segmental arteries: omitting the tracheal images. GGO, ground glass opacity. The red triangle showed the adequate resection margins of this case.

