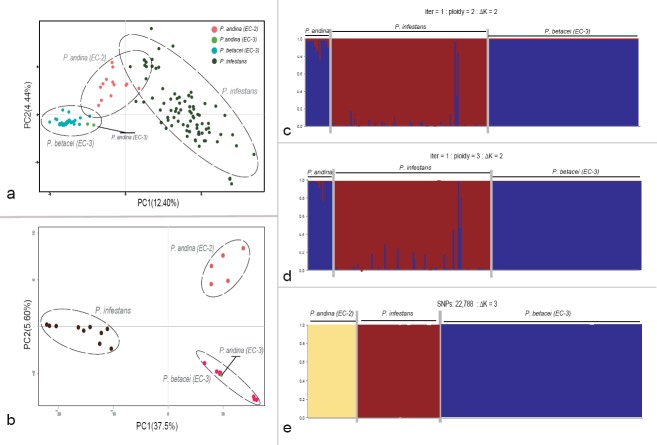
Fig. 2.
Principal component analysis (PCA) and STRUCTURE results for microsatellite and Genotyping-by-sequencing data showing the genetic structure for P. betacei, P. andina and P. infestans. a–b. Results for PCA analysis for SSR and GBS data, respectively. Principal components (PC) 1 and 2 are shown and the percentage of variance explained by each eigenvalue is shown within parentheses on each axis. Individuals of P. infestans are shown in blue, P. andina in orange and P. betacei in green; c–d. STRUCTURE results for SSR data for resampled diploid and triploid datasets, respectively (ΔK = 2); e. STRUCTURE results for Genotyping-by-sequencing data. data (ΔK = 3). Classification of Phytophthora samples was established according to the optimal population number (Evanno's method). The distribution of the individuals in different populations is indicated by the different colours on each plot.

