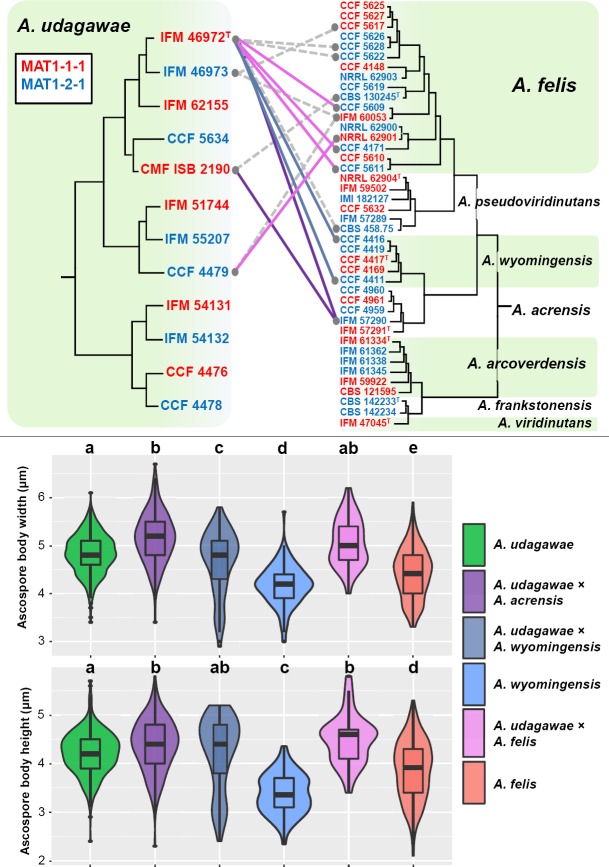
Fig. 8.
Schematic depiction of results of interspecific mating experiments between opposite mating type isolates of A. udagawae and other heterothallic members of Aspergillus viridinutans species complex. Only successful mating experiments are displayed by coloured connecting lines between opposite mating type isolates (different colours correspond to hybrids between different species); grey dashed lines indicate production of infertile ascomata; remaining mating experiments were negative. Boxplot and violin graphs were created in R 3.3.4 (R Core Team 2015) with package ggplot2 (Wickham 2009) and show the differences between the width and height of ascospores of particular species and their hybrids. Different letters above the plot indicate significant difference (P < 0.05) in the size of the ascospores based on Tukey's HSD test. Boxplots show median, interquartile range, values within ± 1.5 of interquartile range (whiskers) and outliers.

