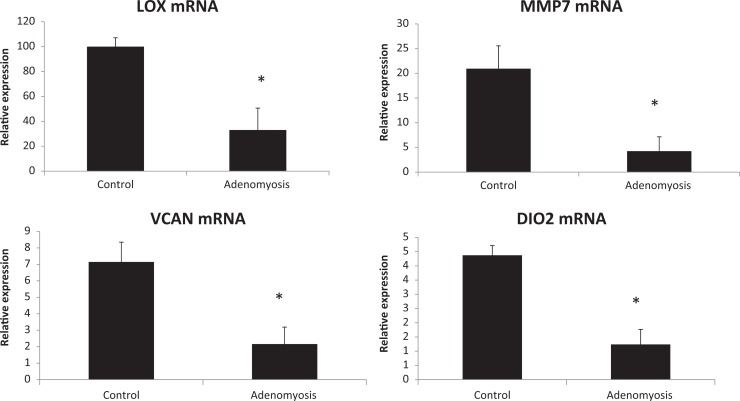
Figure 3.
Quantitative real-time reverse transcriptasepolymerase chain reaction (QPCR) validation of microarray data in proliferative phase adenomyosis (n = 3) and control samples (n = 5) expressed as relative expression to the levels of endogenous control RPL19. *Statistically significant differences (p < 0.05) determined by one-way ANOVA. Error bars represent standard error of mean (SEM). LOX, lysyl oxidase; MMP7, matrix metalloproteinase 7; VCAN, versican; DIO2, thyroxine deiodinase 2.

