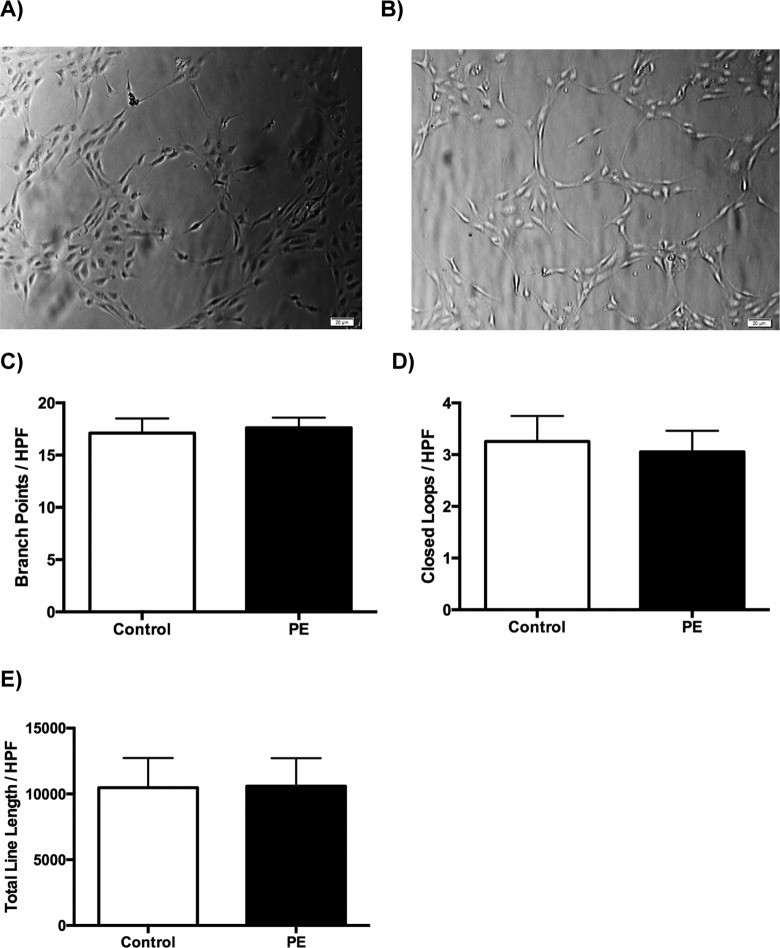
Figure 5.
A, A representative phase-contrast micrograph of tube formation in control cell lines. B, A representative phase-contrast micrograph of tube formation in PE cell lines. C, The number of branch points per high-power field; the bars represent mean ± SEM. Control cell lines did not show any significant difference in the number of branch points, 17.1 ± 1.4 when compared to the PE cell lines, 17.6 ± 1.0 (P =.77). D, Similarly, the number of closed loops (D) and total line length (E) per high-power field also do not show any difference, 3.3 ± 0.5 versus 3.1 ± 0.4 (P = .76) and 10,480 ± 360 versus 10,598 ± 349 (P = .82), respectively. PE indicates preeclampsia; SEM, standard error of the mean.

