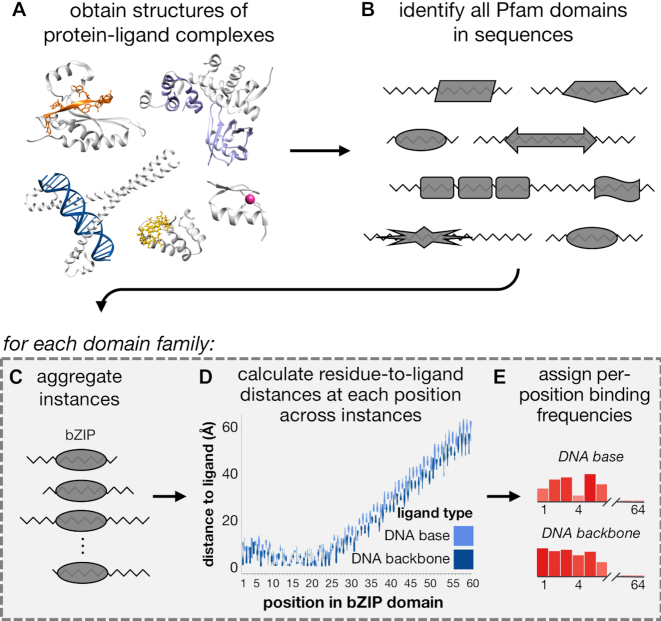
Figure 1.
Workflow for computing per-position binding frequencies for domains. (A) Structures of protein–ligand binding complexes are obtained from BioLiP (24); pictured here are proteins in complex with DNA (blue, PDB ID: 4auw), RNA (orange, PDB ID: 5els), peptides (purple, PDB ID: 5ibk), a zinc ion (pink, PDB ID: 1aay) and the small molecule GMP (yellow, PDB ID: 5tzd). Protein chains are colored gray. (B) Instances of Pfam domain families are found across BioLiP structures. For each Pfam domain family found in (B), we (C) aggregate all instances by ligand-binding type, (D) calculate distributions of minimum distances from residues to ligands and (E) calculate a real-valued binding frequency for each domain position for each ligand type.

