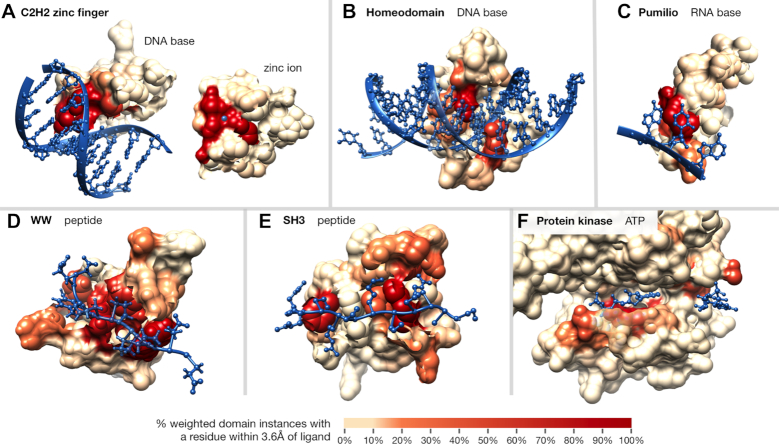
Figure 2.
Examples of domains scored according to ligand-binding frequency. Residues within interaction domain structures are colored according to their ligand-binding frequencies; domains pictured include: (A) C2H2-ZF domain (PF00096, PDB ID: 1aay, second domain of chain A), the zinc ion is shown on top of the domain for visibility, (B) Homeodomain (PF00046, PDB ID: 1ig7), (C) Pumilio domain (PF00806, PDB ID: 1m8w, third domain of chain B), (D) WW domain (PF00397, PDB ID: 2n1o), (E) SH3 domain (PF00018, PDB ID: 2bz8) and (F) protein kinase domain (PF00069, PDB ID: 1csn, subdomains I–V, both ATP molecules from two units shown).

