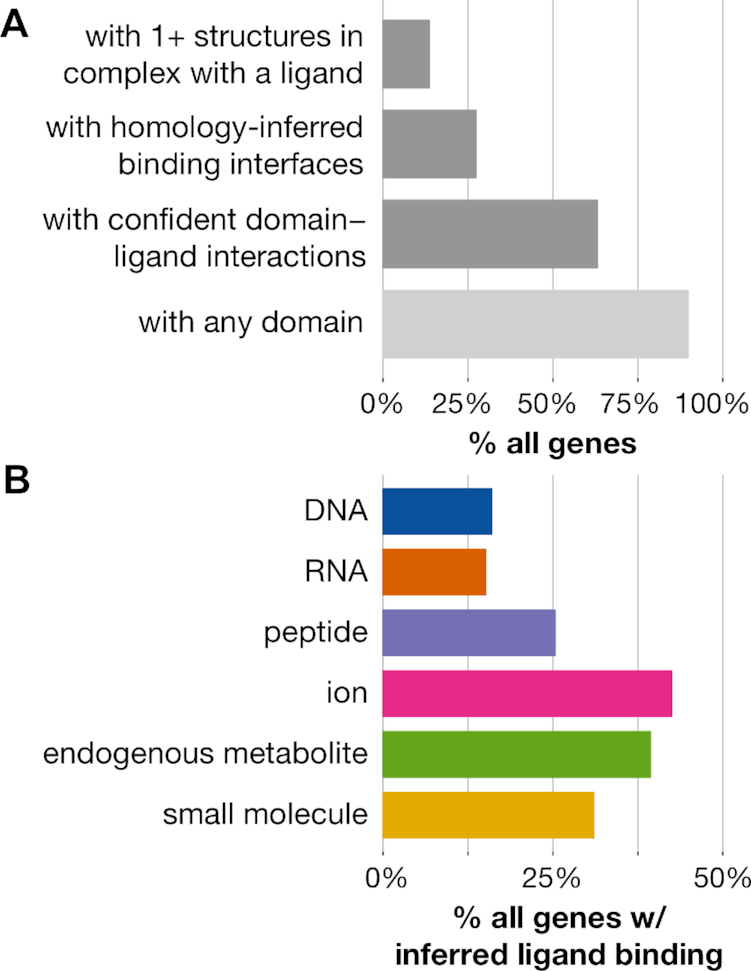
Figure 6.

Interaction domain-based coverage of human genes. (A) Structural and domain-based coverage of 22712 human genes. Dark gray bars indicate ways by which to structurally infer protein interaction interfaces. (B) Percentages of genes estimated to interact with specific ligand types using the confident set of domain–ligand interactions.
