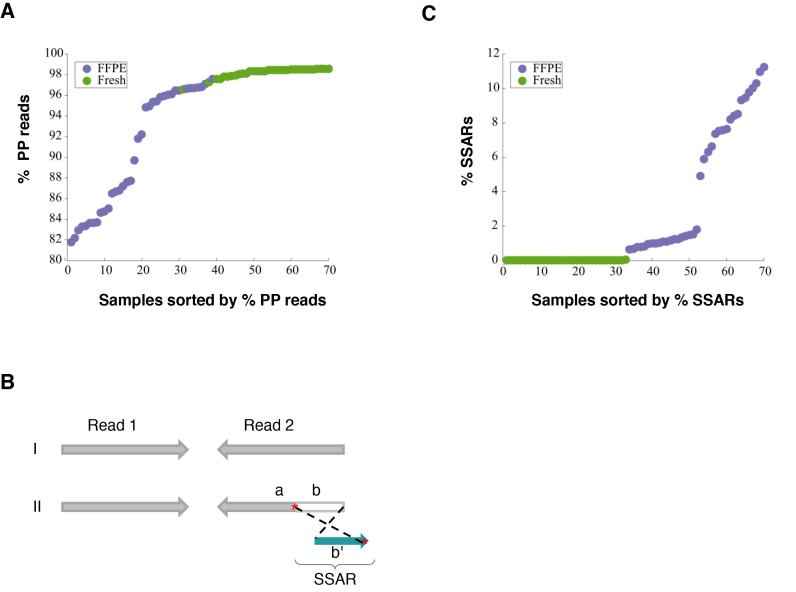
Figure 1.
Differences in library quality between matched FFPE and FF tissue samples and possible underlying mechanism. (A) Comparison of the frequency of properly paired (PP) reads between matched FFPE (n = 38) and FF (n = 38) tissue samples. (B) Diagrammatic depiction of Strand-split artifact reads (SSARs). Typical PP reads (I) and an example of PP reads with SSAR in Read 2 (II) are shown. For III, Read 1 is contiguously aligned to the reference genome while Read 2 is split into two parts. Part ‘a’ of Read 2 aligns in the expected paired-end orientation while the distal end of Read 2 (part ‘b’) does not match the reference sequence at that position. Part ‘b’ of Read 2 does match the reference genome near Part ‘a’, but aligns in the opposite orientation (b’). Sequence homologies in the reference genome between the regions are marked with red asterisks ‘*’. (C) Comparison of SSAR levels between matched FFPE (n = 38) and FF (n = 38) tissue samples.

