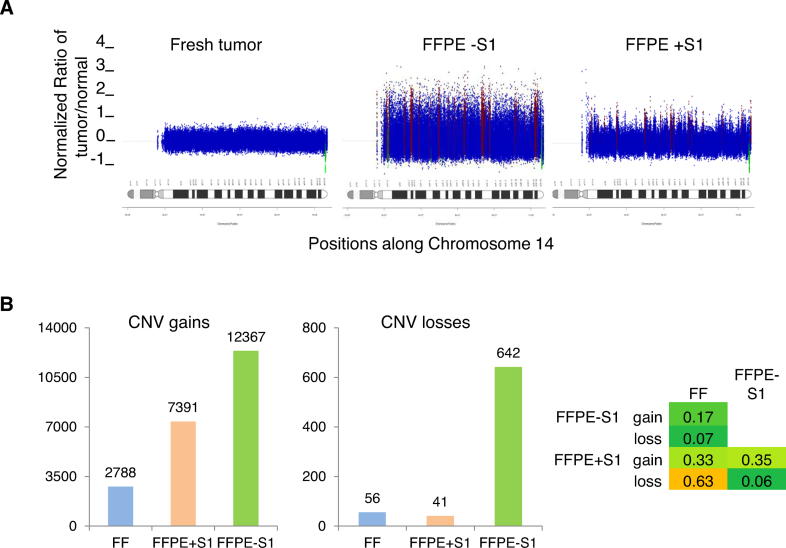
Figure 6.
Effects of S1 nuclease treatment on FFPE-associated CNV noise. (A) Example illustrating CNV noise. Samples are the same as in Figure 5. Using a bin size of 200 reads, CNV segments were calculated in the tumor samples relative to the normal blood sample and the resulting profile is shown for chromosome 14. (B) CNV counts at the gene level. Gains are shown on the left and losses are shown in the middle panel. Jaccard's intersection index (Materials and Methods) is shown in the right panel as a measure of overlap of gene-level CNVs between the three samples.

